
Figures & data
Table 1. The identification and classification of endophytic bacteria based on culture-dependent and DGGE methods.
Figure 1. Comparison of phylum level distributions for three tissue types from culture and DGGE methods.
Figure 2. Comparison of phylum level distributions for three tissue types based on the metagenome method.
Table 2. Comparison of percentage (%) of the metagenome sequences affiliated with the dominant bacterial genera (average abundance >1%) for three tissue sample types.
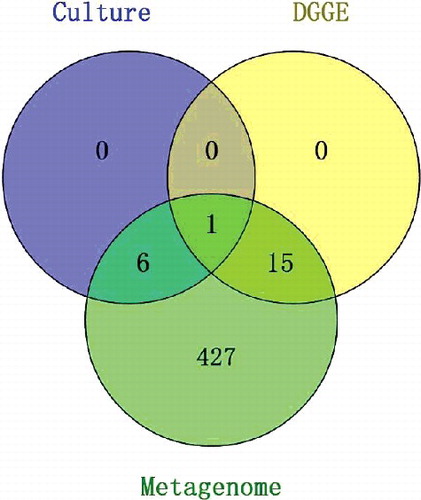
Figure 3. Comparison of genus levels using metagenome, culture-dependent, and DGGE methods.
Supplemental material