Figures & data
Table 1. Studied genotypes and cultivars with their collection area.
Table 2. Sequence of RAPD primers and calculated genetic indices based on information obtained from studied samples.
Figure 1. Dendrogram obtained from cluster analysis of samples from Rosaceae family based on Jaccard's similarity coefficient and UPGMA method.
Table 3. Eigen values, variance and cumulative variance obtained from seven main factors in diversity analysis in Rosaceae family.
Figure 2. TriPlot obtained from PCA analysis of all samples showing genetic differences of different genera of pome fruit trees from Iran.
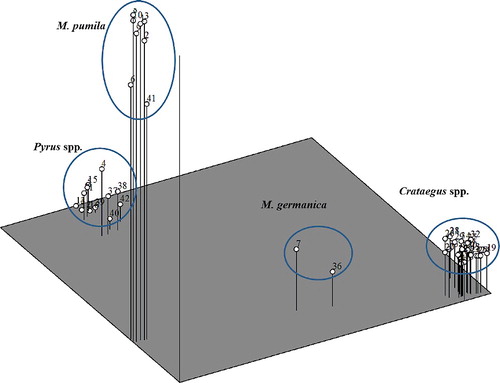
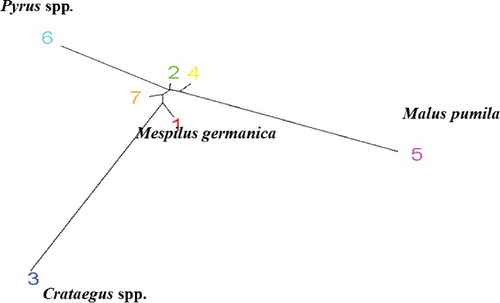
Figure 3. Phylogenetic tree of different genera based on banding pattern from random primers using TreeView software.
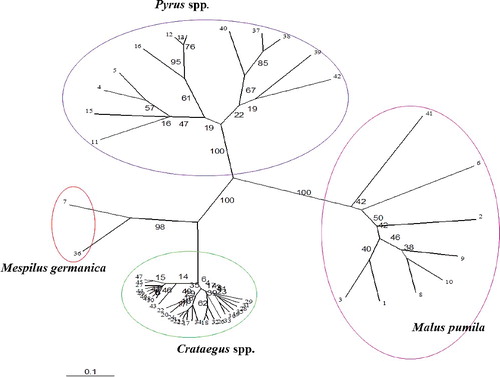
Figure 4. Grouping of samples using STRUCTURE software based on K = 2 (A); based on K = 7 (B).
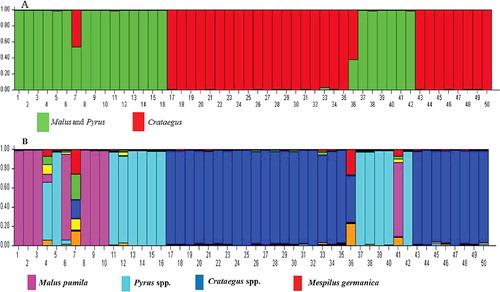
Figure 5. Similarity between different genera studied in this experiment based on banding pattern from random primers using STRUCTURE software.