Figures & data
Figure 1. The changing in colour of supernatant free bacterial cell after addition of silver nitrate for synthesis silver nanoparticles.

Figure 2. UV-visible spectra for silver nanoparticles (1 mM aqueous solution of AgNO3) synthesized by Bacillus aerius. The inset of the figure shows a test tube of the silver nanoparticle solution formed at the end of the reaction.
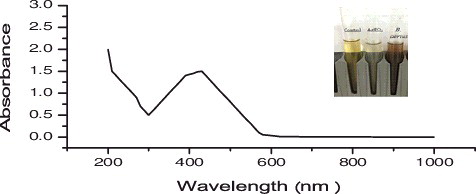
Figure 3. TEM micrograph at 30.000 time magnification and energy dispersive spectroscopy (EDX) spectrum of silver nanoparticles that were synthesized by Bacillus aerius. The scale bar corresponds to 100 ηm.
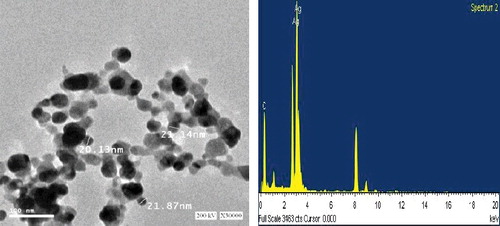
Figure 4. The Fourier transform infrared (FTIR) spectrums of silver nanoparticles synthesized by Bacillus aerius.
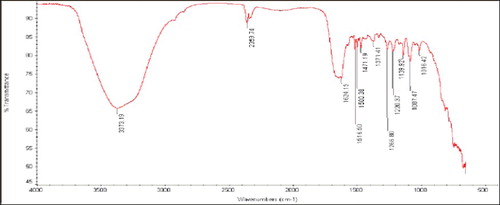
Figure 5. UV-visible spectra of silver nanoparticles obtained at different temperature of 30, 40, 50, 60, 70 and 80 °C.
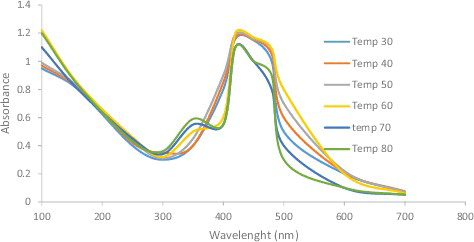
Figure 6. UV-visible spectra of silver nanoparticles at different pH values (pH = 5–11) of the reaction mixture.
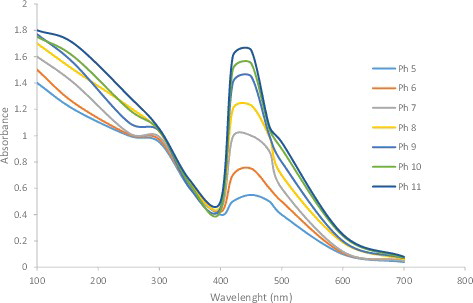
Figure 7. UV-visible spectra of silver nanoparticles obtained at different silver nitrate concentrations of 0.5–5 mM.
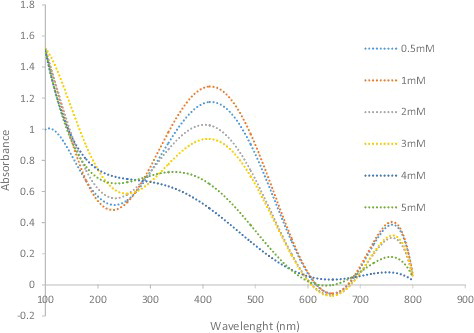
Table 1. Antimicrobial activity of silver nanoparticles (AgNPs) synthesized by two bacterial isolates on some different pathogenic strains.
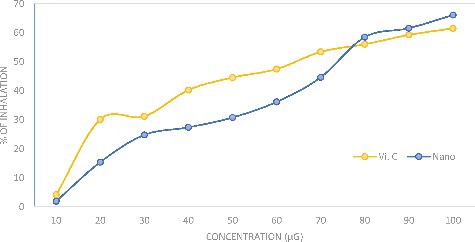
Figure 8. DPPH scavenging activity of silver nanoparticles compared with the standard ascorbic acid.