Figures & data
Figure 1. (Color online). Gene structure of plastidic ATP/ADP transporter protein from Solanum tuberosum (StAATP). Structure of StAATP and StAATP (A): the StAATP protein contained an ADP/ATP carrier protein domain. Exon/intron organization of the StAATP gene (B) with location of exons (brown boxes) and introns (blue lines): the genomic DNA of StAATP gene was 3175 bp. Prediction of transmembrane helices (C) in the StAATP protein.
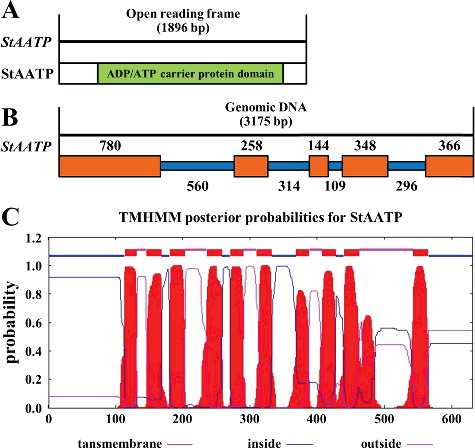
Figure 2. (Color online). Multiple sequence alignment of AATP proteins from Solanum tuberosum (StAATP), Arabidopsis thaliana (AtAATP1, 2), Coffea canephora (CcAATP), Ipomoea batatas (IbAATP), Mentha spicata (MsAATP), Mesembryanthemum crystallinum (McAATP), Oryza sativa (OsAATP1, 2), Sesamum indicum (SiAATP), Solanum lycopersicum (SlAATP), Theobroma cacao (TcAATP) and Zea mays (ZmAATP).
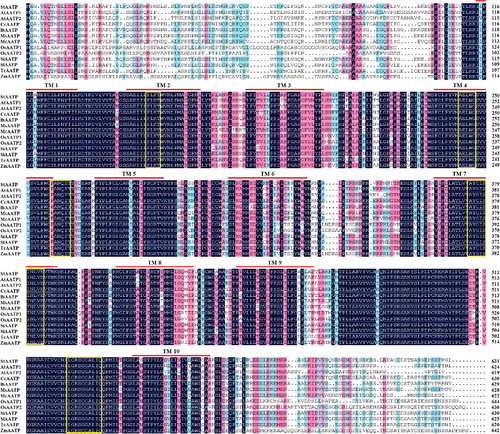
Figure 3. Phylogenetic analysis of plastidic ATP/ADP transporters from Solanum tuberosum (StAATP) and other plant species.
Figure 4. Molecular confirmation of transgenic plants. Schematic diagram (A) of the T-DNA region of binary plasmid pCAMBIA1301-StAATP: LB, left border; RB, right border; hptII, hygromycin phosphotransferase II gene; StAATP, potato plastidic ATP/ADP transporter protein gene; gusA, β-glucuronidase gene; 35S, cauliflower mosaic virus (CaMV) 35S promoter; 35S T, CaMV 35S terminator; NOS T, nopaline synthase terminator. PCR analysis (B) of StAATP-expressing Arabidopsis plants: Lane M, DL2000 DNA marker (Transgen, Beijing, China); Lane W, water as a negative control; Lane P, plasmid pCAMBIA1301-StAATP as a positive control; Lane WT, wild type; VC, control vector; Lanes #1–#5, different transgenic lines. Expression levels (C) of StAATP in different transgenic lines. The Arabidopsis actin gene was used as an internal control.
Figure 5. Starch content analysis in the leaves of WT and transgenic plants.
Figure 6. Transcript levels of starch biosynthesis genes in the leaves of WT and transgenic plants.
Figure 7. AGPase, GBSS, SSS and SBE enzyme activity assays in the leaves of WT and transgenic plants.
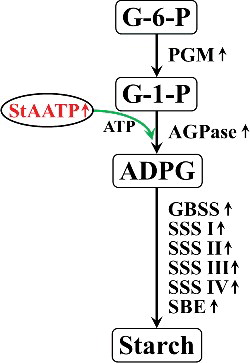
Figure 8. A proposed model of the regulatory network of StAATP in starch accumulation.