1,824
Views
22
CrossRef citations to date
0
Altmetric
Article; Agriculture and Environmental Biotechnology

Cobalt(II) bioaccumulation and distribution in Rhodopseudomonas palustris

, , , &
Pages 527-534 | Received 20 Jul 2016, Accepted 03 Feb 2017, Published online: 20 Feb 2017

Figures & data

Figure 1. Effect of metabolic pathways on Co2+ removal efficiency and growth incubated in the enrichment medium with the addition of 80 mg/L Co2+, 30 °C and pH 6.5. The error bars represent the standard deviation at n = 3.
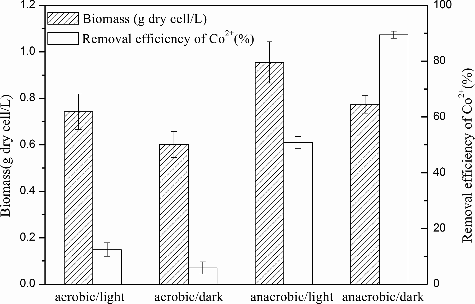
Figure 1. Effect of metabolic pathways on Co2+ removal efficiency and growth incubated in the enrichment medium with the addition of 80 mg/L Co2+, 30 °C and pH 6.5. The error bars represent the standard deviation at n = 3.

Figure 2. Effect of pH on Co2+ removal efficiency and growth incubated in the enrichment medium with the addition of 80 mg/L Co2+, 30 °C and aerobic condition in darkness. The error bars represent the standard deviation at n = 3.
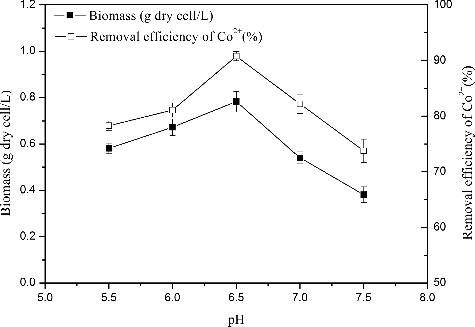
Figure 2. Effect of pH on Co2+ removal efficiency and growth incubated in the enrichment medium with the addition of 80 mg/L Co2+, 30 °C and aerobic condition in darkness. The error bars represent the standard deviation at n = 3.

Figure 3. Effect of temperature on Co2+ removal efficiency and growth incubated in the enrichment medium with the addition of 80 mg/L Co2+, pH 6.5 and aerobic condition in darkness. The error bars represent the standard deviation at n = 3.
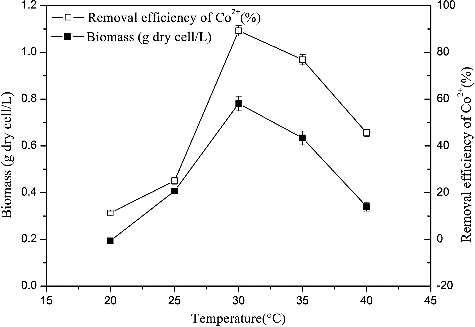
Figure 3. Effect of temperature on Co2+ removal efficiency and growth incubated in the enrichment medium with the addition of 80 mg/L Co2+, pH 6.5 and aerobic condition in darkness. The error bars represent the standard deviation at n = 3.

Figure 4. Effect of co-cations on Co2+ removal efficiency incubated in the enrichment medium with the addition of 80 mg/L Co2+, pH 6.5, 30 °C and aerobic condition in darkness. The error bars represent the standard deviation at n = 3.
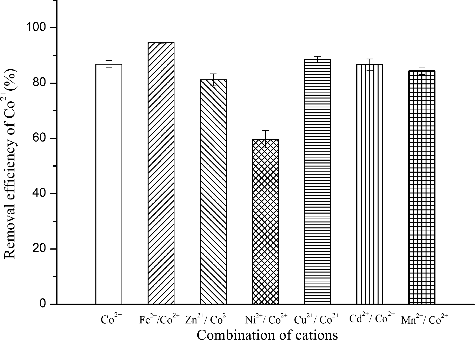
Figure 4. Effect of co-cations on Co2+ removal efficiency incubated in the enrichment medium with the addition of 80 mg/L Co2+, pH 6.5, 30 °C and aerobic condition in darkness. The error bars represent the standard deviation at n = 3.
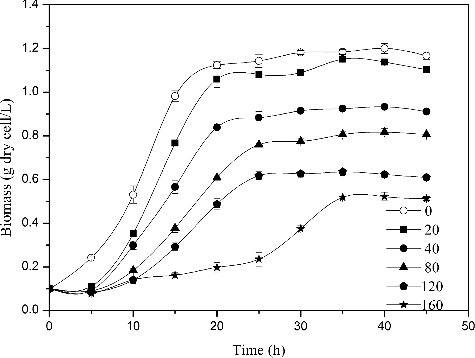
Figure 5. Effect of initial cobalt concentration on growth incubated in the enrichment medium, pH 6.5, 30 °C and aerobic condition in darkness. The error bars represent the standard deviation at n = 3.
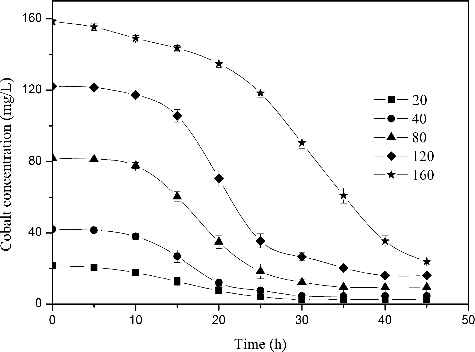
Figure 5. Effect of initial cobalt concentration on growth incubated in the enrichment medium, pH 6.5, 30 °C and aerobic condition in darkness. The error bars represent the standard deviation at n = 3.

Figure 6. Removal of different concentrations of Co2+ by R. palustris, pH 6.5, 30 °C and aerobic condition in darkness. The error bars represent the standard deviation at n = 3.

Figure 6. Removal of different concentrations of Co2+ by R. palustris, pH 6.5, 30 °C and aerobic condition in darkness. The error bars represent the standard deviation at n = 3.

Table 1. Pseudo-first-order model kinetic equations and kinetic parameters of the removal for different concentration of cobalt by growing R. palustris.

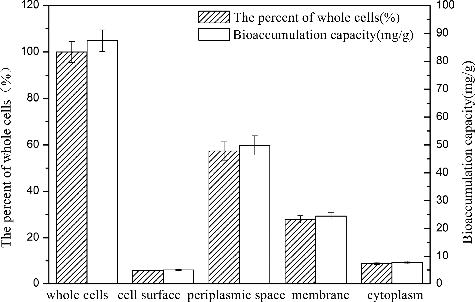
Table 2. Pseudo-second-order model kinetic equations and kinetic parameters of the removal for different concentration of cobalt by growing R. palustris.
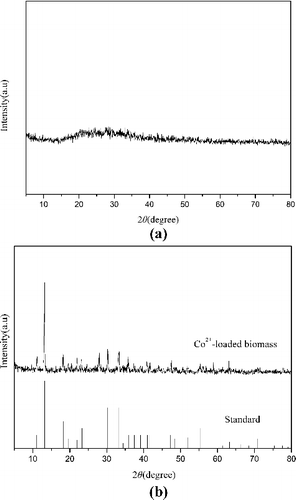
Figure 7. Cobalt compartmentalization in selected cell sectors of R. palustris.

Figure 7. Cobalt compartmentalization in selected cell sectors of R. palustris.

Figure 8. X-ray diffraction spectra of R. palustris cells: (a) metal-free control; (b) Co2+-loaded (80 mg/L, 40 h) biomass.

Figure 8. X-ray diffraction spectra of R. palustris cells: (a) metal-free control; (b) Co2+-loaded (80 mg/L, 40 h) biomass.