Figures & data
Figure 1. Schematic diagram of the hexa-histidine tagged PEDV-S1 fusion protein. PEDV-S1 fusion protein was cloned under strong T7 promoter. Amino acid numbering starts with the N-terminus of His-tag (1–10), followed by highly specific TEV protease site (11–18) labelled as X-site and PEDV-S1 (19-735).
Table 1. Typical growth of cultures under standard expression condition.
Figure 2. Expression of PEDV-S1 fusion protein. PEDV-S1 was expressed using standard expression parameters such as 1 mM IPTG, 37 °C pre- and post-induction temperatures and 3 h post-induction incubations. Overexpressed PEDV-S1 band was seen at expected size in the lane 1 while in the negative controls (lanes 2 and 3; uninduced culture and induced cells without plasmid, respectively) corresponding band was not present.
Table 2. Effect of temperature on the growth of induced and uninduced culture.
Figure 3. Effect of temperature on the overexpression of PEDV-S1. Lane M, low molecular weight marker; 1 induced culture at 24 °C; 2, induced culture at 30 °C; 3, induced culture at 37 °C.
Table 3. Effect of media on the cell density of induced and uninduced culture.
Figure 4. Effect of media on the overexpression of PEDV-S1. Four different rich mediums (nutrient broth, NB; Luria-Bertani, LB; double strength Luria-Bertani, 2 xLB; terrific broth, TB) were tested for optimum expression of PEDV-S1. Lane M, low molecular weight marker; 1, uninduced in NB;2, induced in NB; 3, uninduced in 2 xLB; 4, induced in LB; 5, uninduced in 2 xLB; 6, induced in 2 xLB; 7, uninduced in TB; 8, induced in TB.
Figure 5. Growth vs. inducer concentration. (a) Effect of IPTG concentration on the final growth of E. coli cells expressing PEDV-S1. As the concentration of IPTG increases up to 400 lM, the final growth decreases proportionally. (b) SDS-PAGE analysis of effect of inducer concentration on the overexpression of PEDV-S1. Here, effect of 0–1000 μM IPTG was examined. Lane M, Protein marker; lane 1, 0 μmol/L; lane 2, 10 μmol/L; lane 3, 25 μmol/L; lane 4, 50 μmol/L; lane 5, 100 μmol/L; lane 6, 250 μmol/L; lane 7, 500 μmol/L; lane 8, 1000 μmol/L.
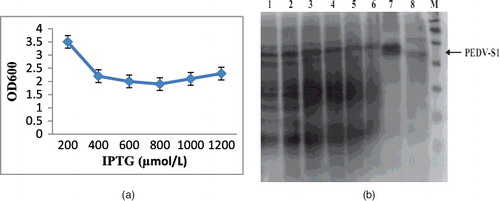
Figure 6. Effect of pre-induced growth on the expression o PEDV-S1. Culture was induced at different growth phases. Crude soluble extract was loaded on Western blot. Lane M, low molecular weight marker; lane 1, induction at OD 0.3; lane 2, induction at OD 0.6; lane 3, induction at OD 1.2 and lane 4, induction at OD 1.8.
Table 4. Effect of pre-induction growth on the final cell density.
Figure 7. (a) Effect of post-induced incubation on the expression of PEDV-S1. After induction, E. coli culture expressing PEDV-S1 was incubated at 37 °C. Aliquot of culture was removed at different time intervals. Soluble protein was extracted and analyzed on SDS-PAGE. The yield of soluble camel protein remained same up to 24 h of incubation. (b) Post-induction incubation vs. growth in the shake flask culture. The growth of induced culture increases with time but the growth was ceased after 5 h of incubation, resulting in no further increase in biomass after 5 h of post-induction incubation.
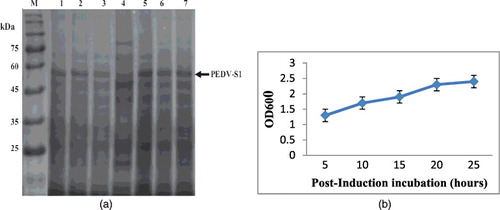
Figure 8. (a) Ni–NTA purification of (His) 6-tagged PEDV-S1 fusion protein. Crude extract was subjected to Ni–NTA chromatography. The crude extract was passed through the column, equilibrated with 50 mmol/L Tris, 10 mmol/L imidazole, and 500 mmol/L sodium chloride pH 7.5. The column was washed with 50 mmol/L Tris, 10 mmol/L imidazole, and 500 mmol/L sodium chloride pH 7.5. His-tagged PEDV-S1 was eluted by a linear 0%–50% gradient of 50 mmol/L Tris, 500 mmol/L imidazole, and 500 mmol/L sodium chloride, pH 7.5. The protein chromatogram is shown with the solid line. Fractions indicated by arrows were analyzed on SDS–PAGE. (b) The protein separation was done on 10% SDS-PAGE. Lane M, low molecular weight marker; lane 1, crude extract; lane 2, flow through; lane 3, wash; lane 4, fraction 11; lane 5, fraction 13; lane 6, fraction 17; lane 7, fraction 19; lane 8, fraction 21; lane 9, fraction 23.
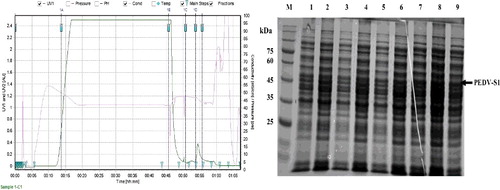
Figure 9. (a) Final purification of PEDV-S1 via size exclusion chromatography. Gel filtration column (Superdex 75) was pre-equilibrated with 25 mmol/L Tris, 250 mmol/L sodium chloride, pH 7.5. The purity of the fractions indicated with arrow was analyzed on SDS–PAGE. (b) Analysis of purity of eluted protein from Superdex 75 column by silver staining. Lane M, low molecular weight marker; lane 1, Pool of fractions obtained from size exclusion chromatography.