Figures & data
Table 1. Uniform experimental design.
Table 2. Orthogonal experimental design.
Table 3. Effect of temperature on lactic acid yield.
Table 4. Results from the uniform experimental design.
Table 5. Results from the orthogonal experimental design.
Figure 1. Response surface plot of the lactic acid concentration with respect to inoculum size and fermentation time using the substrate ratio as a centre point.
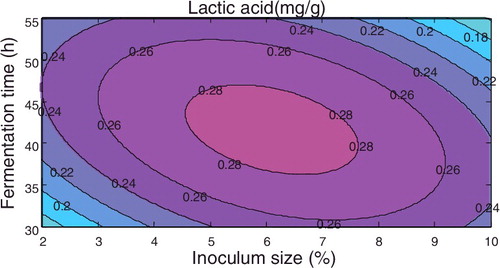
Figure 2. Response surface plot of the lactic acid concentration with respect to inoculum size and substrate ratio using the fermentation time as a centre point.
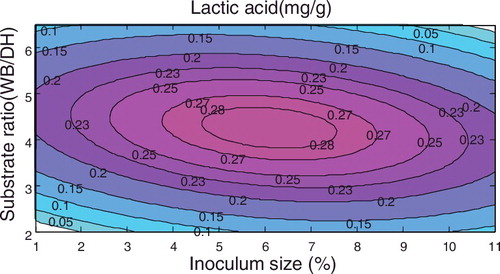
Figure 3. Response surface plot of the lactic acid concentration with respect to fermentation time and substrate ratio using the inoculum size as a centre point.
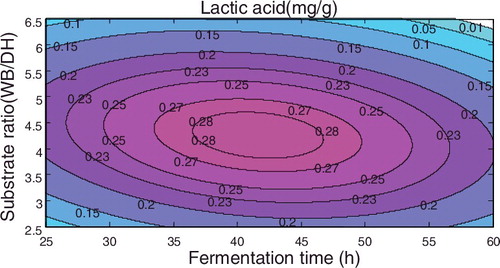
Figure 4. Change of lactic acid amount with respect to inoculum size.
Figure 5. Change of lactic acid amount with respect to fermentation time.
Figure 6. Change of lactic acid amount with respect to substrate ratio.