Figures & data
Figure 1. Schematic of procedures for preparing lithographic microelectrode chips.
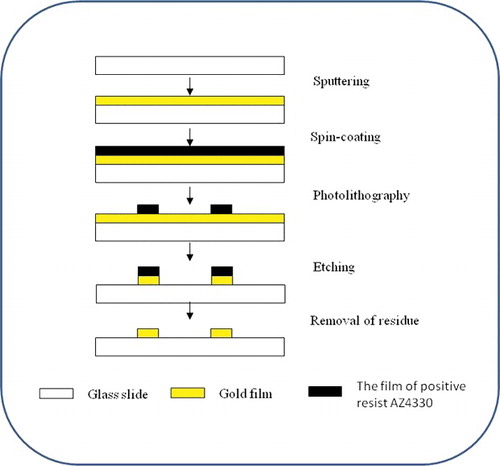
Figure 2. The design drawing of lithographic microelectrode chip.
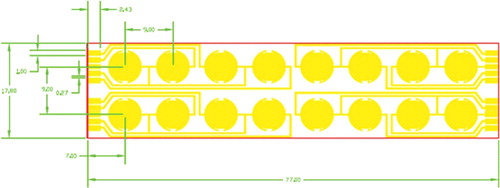
Figure 3. Front (A) and back (B) photographs of a 96-well combined microelectrode chip and a micrograph of a single microelectrode (C) under an optical microscope.
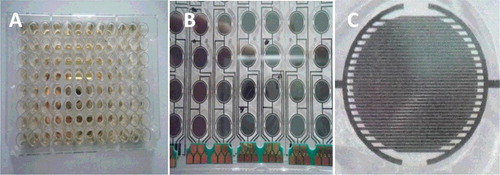
Figure 4. Schematic illustration of the microelectrode-based immunosensor for the detection of E. coli O157:H7.
Figure 5. Clean (A), sediment appearance in gap (B) under ordinary optical microscope × 10. Clean (C), sediment appearance in gap (Dt) under scanning electron microscope.
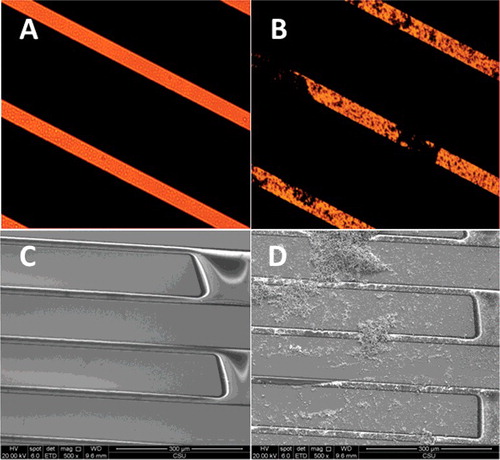
Figure 6. Sediment appearance in gap (A), scanning electron microscope. Electrode element display of Au (B) under energy-dispersive spectroscopy. Sediment appearance display of Ag (C) under energy-dispersive spectroscopy.
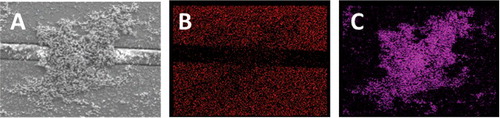
Figure 7. The LSV curves obtained by altering the concentrations of E. coli O157:H7 in PBST.
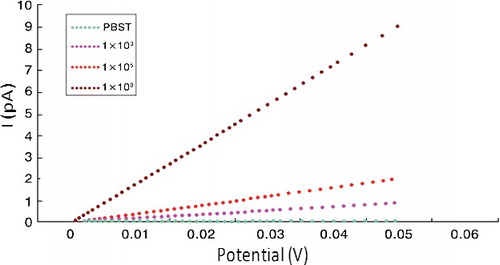
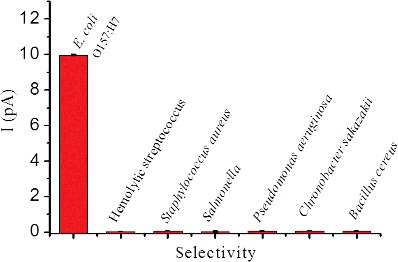
Figure 8. The selectivity of our assay obtained upon addition of various bacteria, including Hemolytic streptococcus, Staphylococcus aureus, Salmonella, Pseudomonas aeruginosa, Chronobacter sakazakii and Bacillus cereus at 108 CFU/mL.