941
Views
2
CrossRef citations to date
0
Altmetric
Article; Pharmaceutical Biotechnology

Enhancing the antitumour-specific immunity of a lung DNA vaccine in vivo by fusion expression of MAGE-A3 and soluble PD-1

, , &
Pages 1064-1069 | Received 05 Sep 2016, Accepted 13 Jun 2017, Published online: 12 Jul 2017

Figures & data

Figure 1. Schematic diagram of DNA vaccines that contain MAGE-A3 and sPD-1 (A) and expression of DNA vaccine in 293T cells (B).
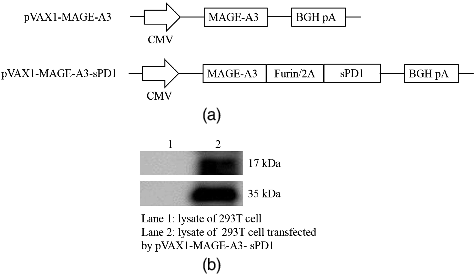
Figure 1. Schematic diagram of DNA vaccines that contain MAGE-A3 and sPD-1 (A) and expression of DNA vaccine in 293T cells (B).

Figure 2. Induction of enhanced MAGE-A3-specific immune responses by sPD1 fusion vaccination. (A) DNA vaccine immunization schedule for C57BL/6 mice. (B) IFN-γ production as a specific response to MAGE-A3 protein determined by antigen ELISPOT assay. (C) IgG1 and IgG2a antibodies specific to MAGE-A3 in sera detected by ELISA. (D) Cytokine profile of proliferating T cells detected by ELISA.
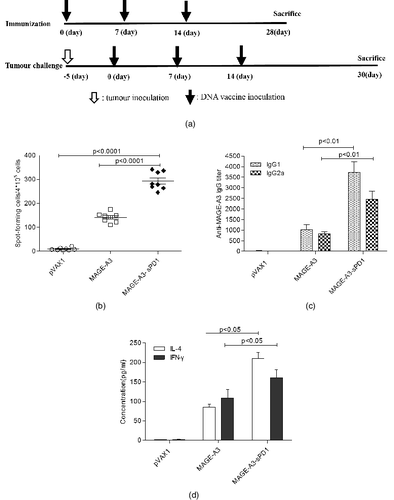
Figure 2. Induction of enhanced MAGE-A3-specific immune responses by sPD1 fusion vaccination. (A) DNA vaccine immunization schedule for C57BL/6 mice. (B) IFN-γ production as a specific response to MAGE-A3 protein determined by antigen ELISPOT assay. (C) IgG1 and IgG2a antibodies specific to MAGE-A3 in sera detected by ELISA. (D) Cytokine profile of proliferating T cells detected by ELISA.
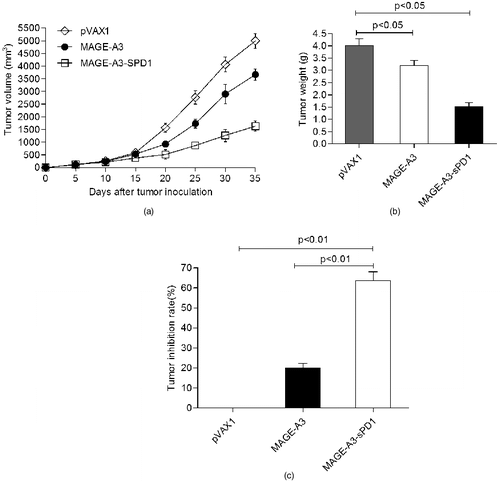
Figure 3. sPD1-based DNA vaccination–induced antigen-specific immunity confers protection against tumour challenge. Growth curve of LLC-MAGE-A3 tumour (A); mean tumour weight (B); tumour inhibition rate (C).

Figure 3. sPD1-based DNA vaccination–induced antigen-specific immunity confers protection against tumour challenge. Growth curve of LLC-MAGE-A3 tumour (A); mean tumour weight (B); tumour inhibition rate (C).