
Figures & data
Figure 1. Von Mises values in cylindrical implants: vertical (a) and oblique (b) loading on D1 bone density; vertical (c) and oblique (d) loading on D4 bone density.
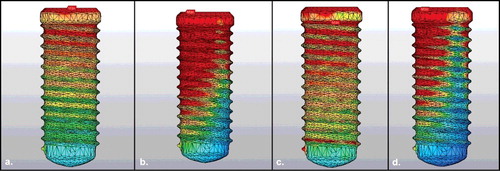
Figure 2. Von Mises values in conical implants: vertical (a) and oblique (b) loading on D1 bone density; vertical (c) and oblique (d) loading on D4 bone density.
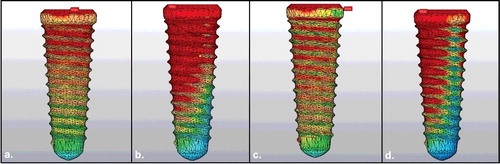
Figure 3. Models of dental implants and mandible used in FEA: conical implant (a); cylindrical implant (b); mandible (c).
Table 1. Young’s modulus and Poisson’s ratio of the materials used in FEA [Citation12,Citation13].
Figure 4. Von Mises values in conical implants. Vertical loading (a); oblique loading (b).
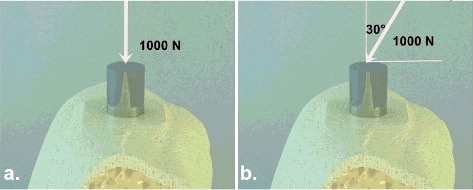
Table 2. Maximum von Mises stress values in the models.