Figures & data
Figure 1. Trabecular structure of proximal femur [Citation11].
![Figure 1. Trabecular structure of proximal femur [Citation11].](/cms/asset/70950513-634f-4878-9b13-8d853fd313cd/tbeq_a_1407256_f0001_oc.jpg)
Figure 2. Human femoral hip head.
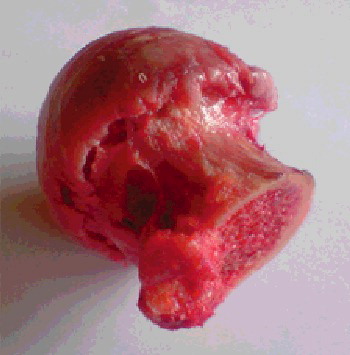
Figure 3. Automatic executive drilling module of ODRO and its accessories.
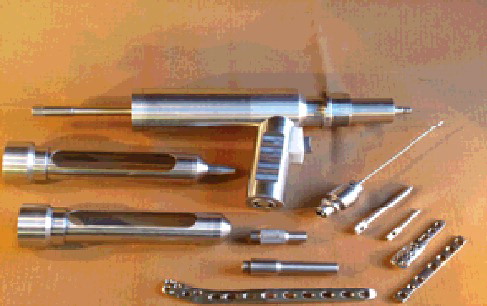
Figure 4. Power/control block of ODRO.
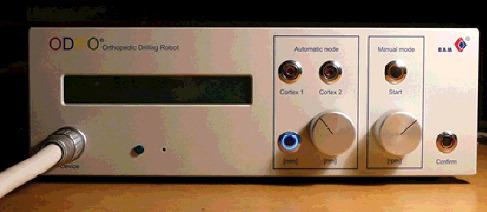
Figure 5. Structure drawing of ODRO. The numbers 1, 2 and 3 indicate the linear drive, the load cell and the rotary drive, respectively.
Figure 6. Experimental setup.
Note: The firm contact between the robot corpus and the bone can be seen.
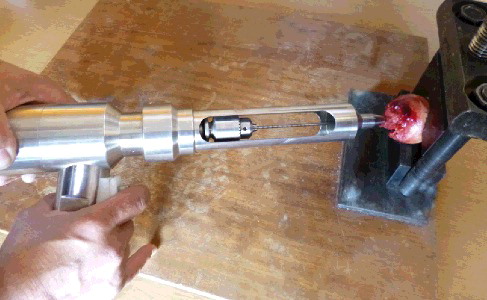
Table 1. Experimental data obtained at 1000 rpm rotation speed and a drill bit diameter of 2.8 mm.
Figure 7. Thrust force as a function of time.
Note: A specimen obtained during arthroplasty in a 78-year-old male patient. Drilling along the femoral head-neck axis; maximum drilling velocity Vmax = 4 mm/s; drill bit 2.8 mm; total time 16.68 s, 2506 AU.
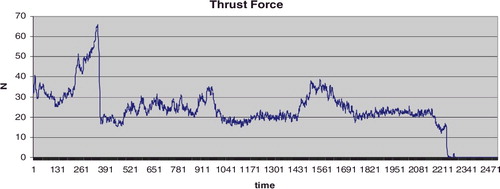
Figure 8. Thrust force as a function of time.
Note: Specimen obtained during arthroplasty in an 80-year-old female patient. Drilling close to the neck wall medially; Vmax = 2 mm/s; drill bit 2.8 mm; total time 15.46 s, 2330 AU.
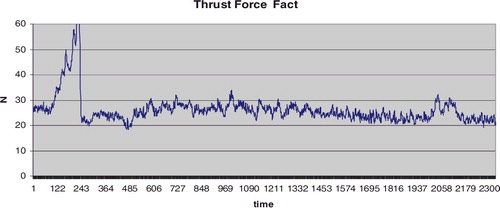
Figure 9. Hip head, man, 78 years old.
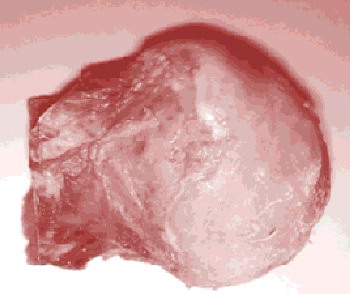
Figure 10. Hip head drilling along the neck axis and far cortex registration for a specimen obtained from a 78-year-old man.
Note: Vmax = 4 mm/s; drill bit 2.8 mm; total time 1500 s, 735 AU; n = 5. Hole depth 46.7 mm (preliminarily set depth of 53.0 mm). The blue line indicates the measured actual thrust force values of . The values of the Integral component Ids (red line) are scaled by multiplication of 10−1.
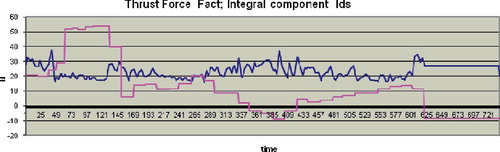
Figure 11. Hip head end registration during drilling close to the wall laterally.
Note: 78-year-old man; Vmax = 4 mm/s; drill bit 2.8 mm; total time 13,797 s, 683 AU; n = 5. Hole depth 38.9 mm (preliminarily set depth of 53.0 mm). The blue line indicates the measured actual thrust force values of . The values of the Integral component Ids (red line) and ΔIds (yellow line) are scaled by multiplication of 10−1.
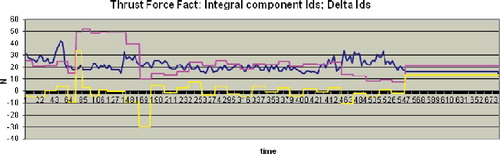
Figure 12. Final result of drilling along the neck axis.
Figure 13. Final result of drilling close to the neck wall laterally.