
Figures & data
Table 1. Distribution of the rat groups.
Table 2. Fracture healing scoring system.
Figure 1. Group I-A with simvastatin. New bone formation around the simvastatin with active connective tissue and rich neovascularisation structure (H&E × 200).
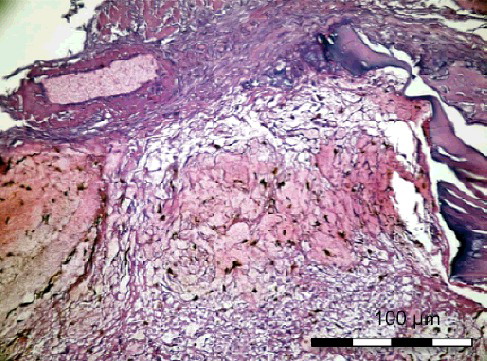
Figure 2. Group I-A without simvastatin. Osteoblasts, differentiated young mesenchymal stem cells and new secreted bone matrix (H&E × 400).
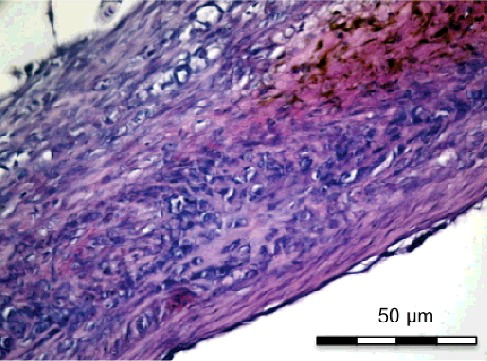
Figure 3. Group II-A with simvastatin. New bone formation with active connective tissue and simvastatin particles (H&E x 100).
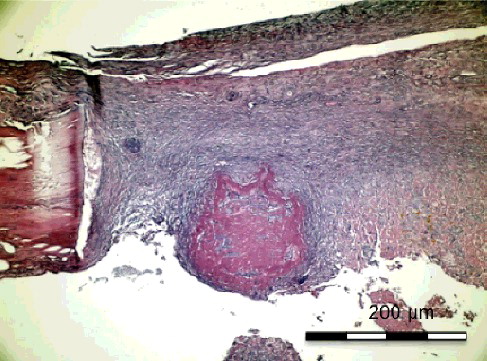
Figure 4. Group II-A without simvastatin. Young and old bleeding areas in the active connective tissue and osteoblastic differentiated young mesenchymal stem cells (H&E × 100).
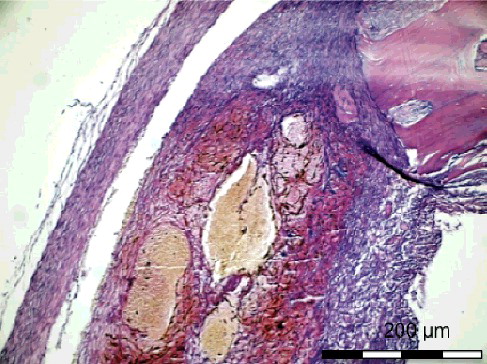
Table 3. Comparison of bone healing, inflammation, necrosis and fibrosis values on day 8.
Figure 5. Group I-B with simvastatin. Ice band like reticular bone formation between defect margins (H&E × 100).
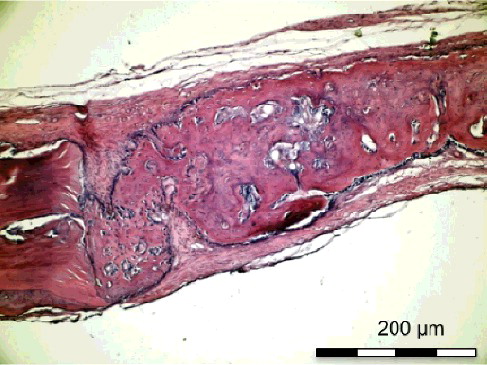
Figure 6. Group I-B without simvastatin. Bridge-like new bone formation covering the defect (H&E × 100)
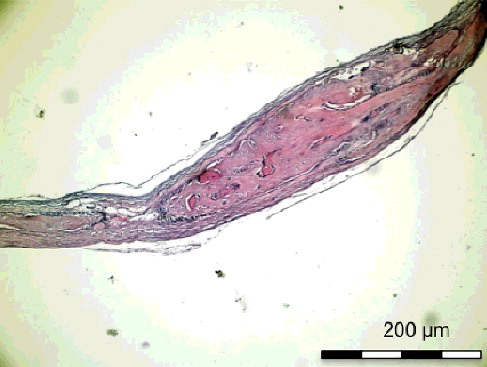
Figure 7. Group II-B with simvastatin. New bone trabecules filling the half of the defect around the simvastatin particles (H&E × 100).
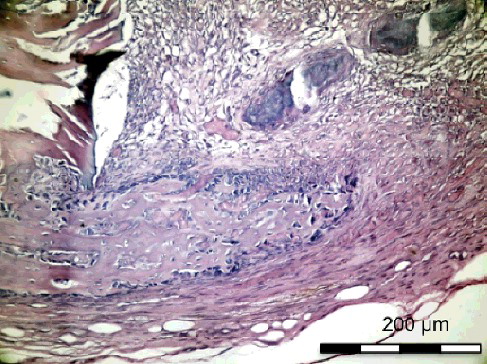
Figure 8. Group II-B without simvastatin. Bridge-like new bone trabecules (H&E × 100).
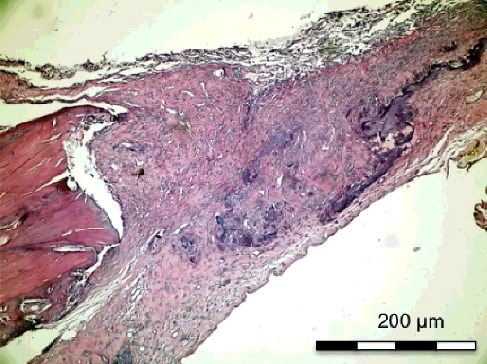
Table 4. Comparison of bone healing, inflammation, necrosis and fibrosis values on day 15.