
Figures & data
Figure 1. Sugar utilizations during fermentation in HS medium and fermentation wastewater.
Figure 2. COD degradation in wastewater during fermentation.
Figure 3. SEM micrographs of BC samples obtained in HS medium (a,b) and in polysaccharide fermentation wastewater (c,d) after 4 days (a,c) or 10 days (b,d) of fermentation.
Figure 4. FT-IR spectra of BC samples obtained in HS medium (a,b) and in polysaccharide fermentation wastewater (c,d) after 4 days (a,c) or 10 days (b,d) of fermentation.
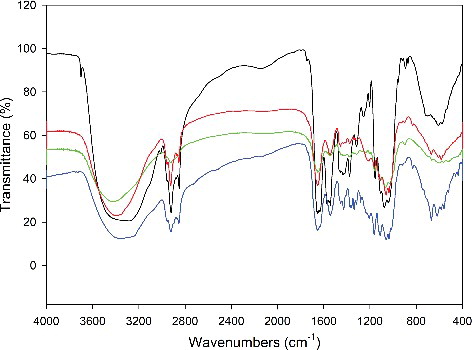
Figure 5. XRD patterns of BC samples obtained in HS medium (a,b) and in polysaccharide fermentation wastewater (c,d) after 4 days (a,c) or 10 days (b,d) of fermentation.
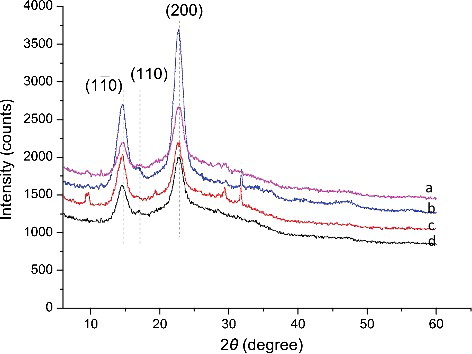
Table 1. Crystallinity and crystal size of BC samples produced in HS medium and fermentation wastewater.
Table 2. Mechanical properties of bacterial cellulose sheets produced in different medium.