Figures & data
Figure 1. Digesters of WWTP ‘Kubratovo’.
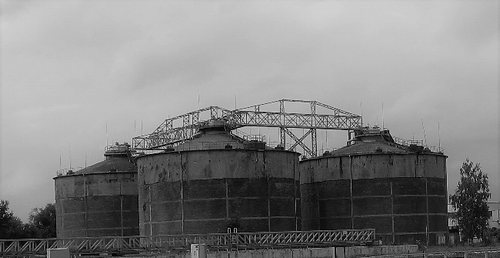
Table 1. Characteristics of the analysed technologies for biogas production
Table 2. Physicochemical and technological parameters of the process in the digesters of WWTP ‘Kubratovo’.
Figure 2. Relationship between the biogas production and aeDHA (a) or anDHA (b) in the eight analysed samples.
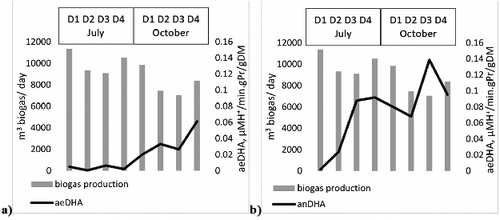
Figure 3. Relationship between the biogas production and the ratio aeDHA/anDHA in the eight analysed samples.
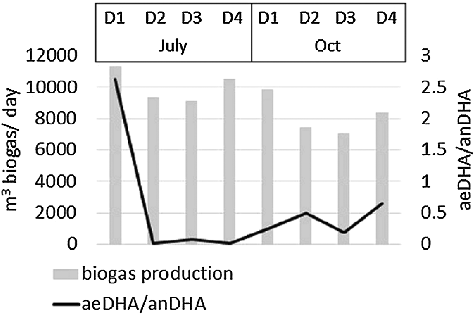
Table 3. Fluorescent image analysis of the biological system in the two sampling periods of the four digesters of WWTP ‘Kubratovo’ vs. total and specific biogas production and methane content (%) in the biogas.
Table 4. Correlation between the analysed technological and functional parameters for control and the total and specific biogas production.
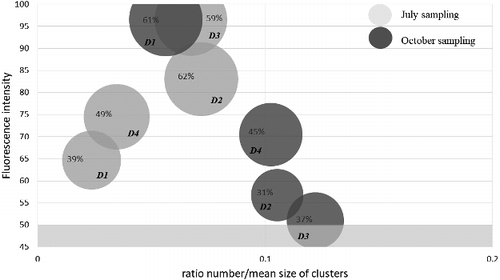
Figure 4. Fluorescent indicative system for assessment of the effectiveness of anaerobic digesters.
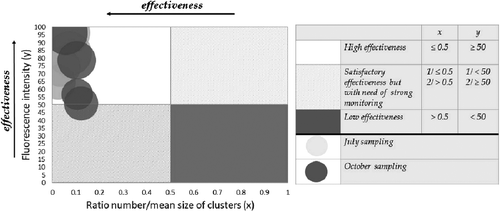
Figure 5. Enlarged part of the chart with the analysed digesters and the area (%) of the fluorescent objects.