
Figures & data
Table 1. Primers used for the single-stranded oligonucleotide synthesis of the target sequence.
Figure 1. Plasmid profile of pYr-1.1-hU6-EGFP. There are XhoI restriction sites on PYr-1.1-hU6-EGFP and shRNA. When the shRNA fragment is successfully inserted into PYr-1.1-hU6-EGFP, PYr-1.1-hU6- EGFP-COX-2-shRNA would have two XhoI restriction sites, with a distance of about 1.7 kb inbetween.
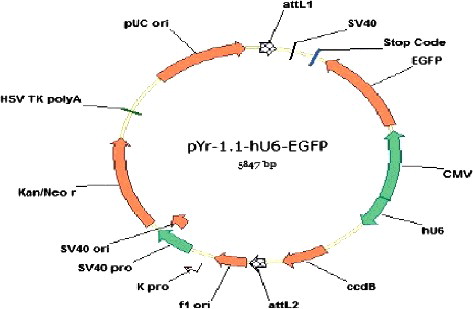
Figure 2. COX-2 gene fragment and XhoI restriction enzyme digestion. M, DNA molecular size marker; Lane 1, pYr-1.1-hU6-EGFP; Lane 2, pYr-1.1-hU6-EGFP-COX2-1; Lane 3, pYr-1.1-hU6-EGFP-COX2-2; Lane 4, pYr-1.1-hU6- EGFP-COX2-3.
Figure 3. Time course of COX-2 mRNA expression in HSCs assessed by RT-PCR. M, molecular size marker; Lane 1: COX-2-shRNA-1 group; Lane 2, COX-2 shRNA-2 group; Lane 3, COX-2 shRNA-3 group; Lane 4, empty vector group; Lane 5, blank control group. The three gels show different expression of COX-2 mRNA in HSCs at 24, 48 and 72 h (from left to right). (a) P < 0.05 vs. the Ad-empty vector group; (b) P < 0.05 vs. the blank group.
Figure 4. Expression of COX-2 protein in HSCs at 48 h assessed by western blot analysis. Lane 0, blank control group; Lane 1, COX-2 shRNA-1; Lane 2, COX-2 shRNA-2; Lane 3, COX-2 shRNA-3. a, P < 0.05 vs. the Ad-empty vector group.
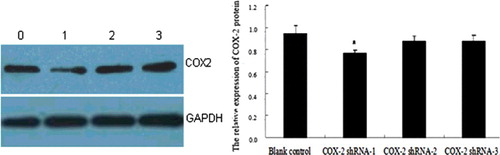
Figure 5. COX-2 mRNA expression in rat liver tissue assessed by RT-PCR. M, molecular size marker; Lane 1, normal control group; Lane 2, model group; Lane 3, COX-2 shRNA-1 group; Lane 4, empty vector group.
Table 2. COX-2 mRNA expression in liver tissue (x ± S.D.).
Figure 6. COX-2 protein expression in liver tissue of SD rats (immunohistochemistry, 400×). Normal control group (A); model group (B); COX-2 shRNA-1 group (C); empty vector group (D).
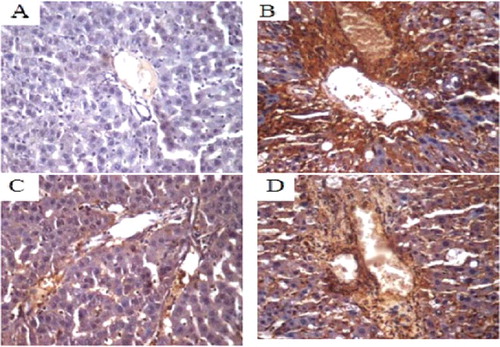
Table 3. COX-2 protein expression in liver tissue (x ± S.D.).
Figure 7. Changes in lipid droplets in the liver tissues of the SD rat groups (Sudan IV staining, 400×). Normal control group (A); model group (B); COX-2 shRNA-1 group (C); empty vector group (D).
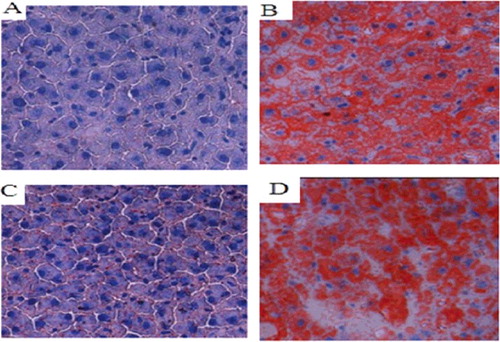
Figure 8. Liver tissues of each SD rat group (HE staining 200×). Normal control group (A); model group (B); COX-2 shRNA-1 group (C); empty vector group (D).
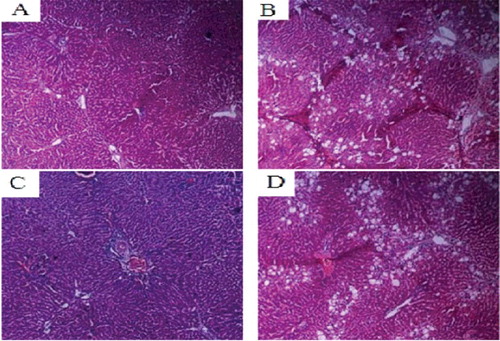
Figure 9. Liver tissues of each SD rat group (collagen Masson staining, 200×). Normal control group (A); model group (B); COX-2 shRNA-1 group (C); empty vector group (D).
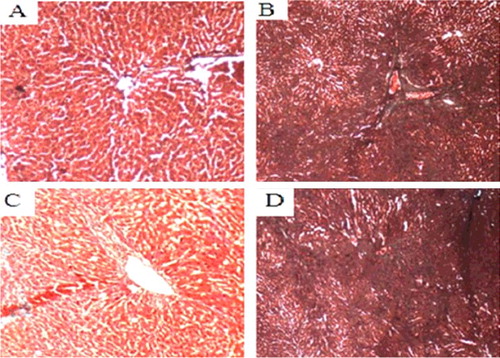
Table 4. Degree of liver fibrosis score and collagen area analysis (x ± S.D.).