Figures & data
Figure 1. Sub-bands used in the discrete wavelet transform implementation (marked in green colour).
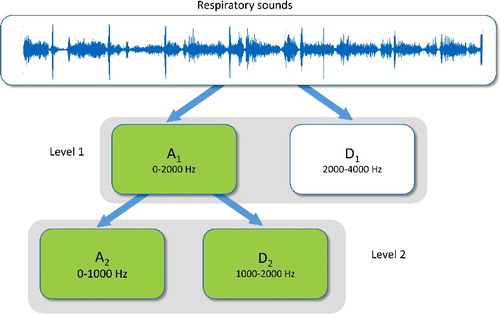
Figure 2. Receiver operating characteristic curve for the validated DTF classifier.
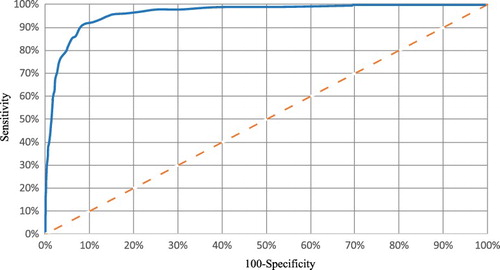
Figure 3. Flowchart with complete information on patient involvement, dropout and AECOPD predicted during the pilot study using a decision tree forest. Symptom-based exacerbations were considered.
Table 1. Classifier performance evaluation.
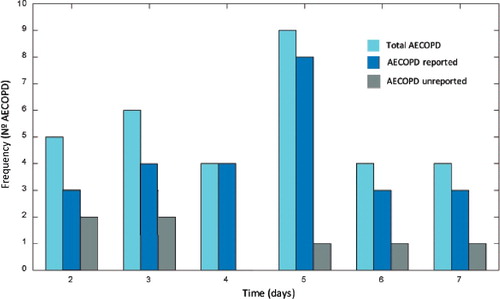
Figure 4. Histogram of prediction margins of total, reported and unreported AECOPD. The horizontal axis indicates the days of prediction prior to AECOPD onset.