Figures & data
Figure 1. DeepFinder framework.
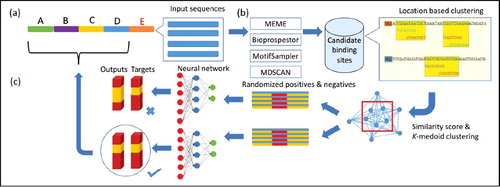
Figure 2. Stacked autoencoder neural network architecture. It consists of 76 input neurons in the input layer, 25 and 15 neurons in the first and second hidden layer, respectively. The output layer has two output neurons which represent motif and non-motif class; b is bias neuron.
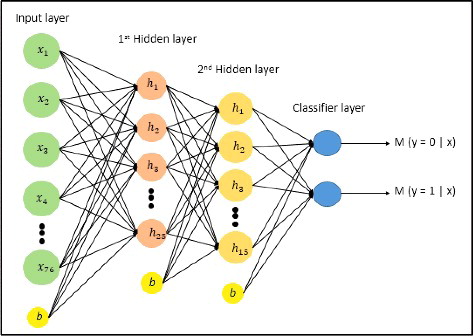
Table 1. Statistics of ten datasets used in this study.
Figure 3. Visual description of true positives (TP), false positives (FP), false negatives (FN) and true negatives (TN) on binding and non-binding regions in prediction. The black region indicates binding sites and the blue stretch indicates DNA region.
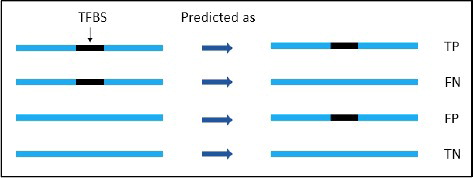
Table 2. Comparison of average precision and the recall and f-measure rates of MAST, FIMO and DeepFinder (DF) using five-fold cross validation.
Table 3. Comparison of false discovery rate (FDR), accuracy, and Matthews correlation coefficient (MCC) of MAST, FIMO, and DeepFinder (DF).
Figure 4. Average f-measure, precision, recall and accuracy rates obtained by DeepFinder on the ten datasets using five-fold cross-validation.
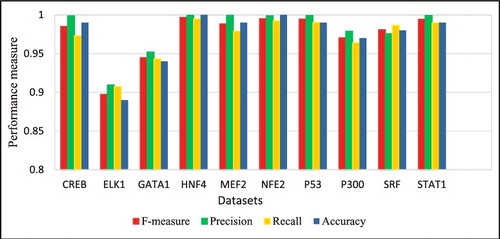
Figure 5. Average precision, recall, f-measure, false discovery rate (FDR) and accuracy for MAST, FIMO and DeepFinder for the ten datasets.
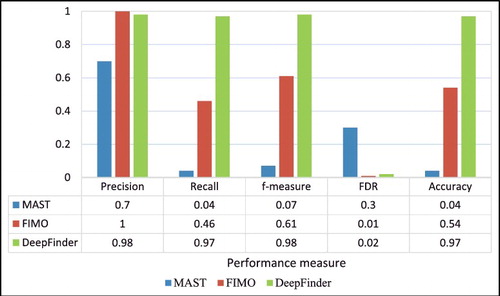
Figure 6. Comparisons of precision rates for five different data subsets used in prediction.
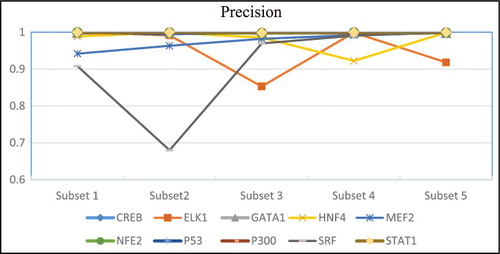
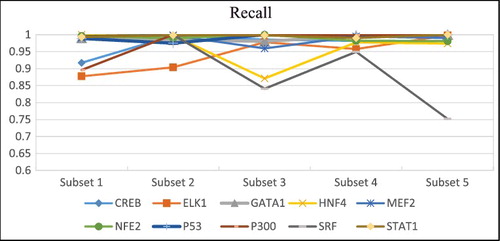
Figure 7. Comparisons of recall rates for five different data subsets used in prediction.