Figures & data
Table 1. Inventoried primers for target genes.
Figure 1. Histological views (H&E stain, magnification × 100) of the sections of the distal root aspect of the first maxillary molars in the control, Ped, OIL-Ped and DIM-Ped groups at 1 week (A, B, C and D) and at 4 weeks (E, F, G and H). Statistical analysis for periodontal tissue inflammation (I).
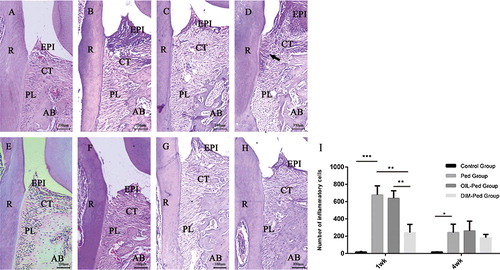
Figure 2. mRNA expression of IL-1β (A and F), IL-6 (B and G), OPG (C and H), RANK (D and I) and RANKL (E and J) in all experimental groups (1 and 4 weeks) determined by RT-qPCR.
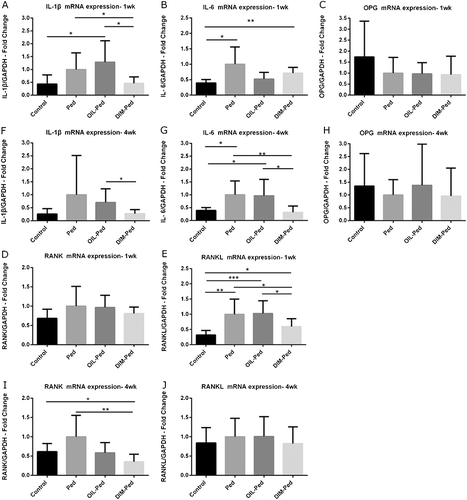
Figure 3. Bidimensional sagittal micro-CT views of the maxillary molars of different animals from each group at 1 (A–D) and 4 weeks (E–H). Three-dimensional sagittal micro-CT views of the maxillary molars of different animals from each group at 1 (I–L) and 4 weeks (M–P). Control group (A, E, I and M); Ped group (B, F, J and N); OIL-Ped group (C, G, K and O) and DIM-Ped group (D, H, L and P).
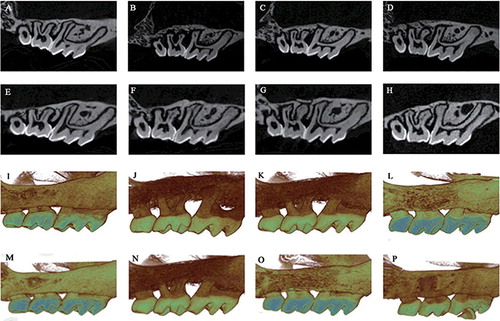
Figure 4. Linear bone loss of the ligature models at 1 (A) and 4 weeks (B).
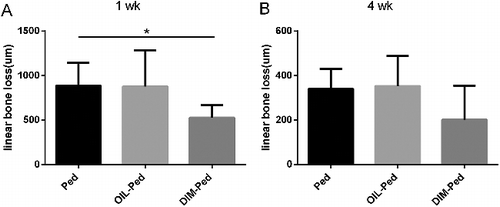
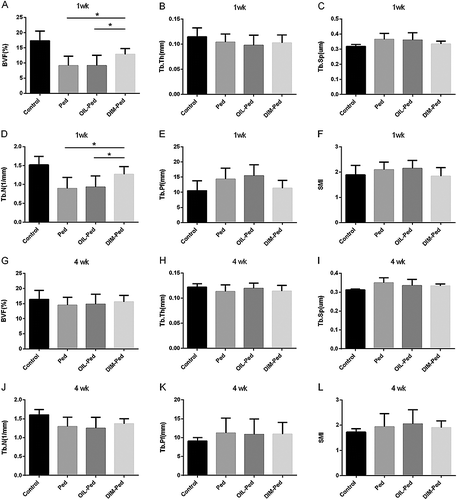
Figure 5. Comparison of micro-CT bone micro parameters measured in a selected ROI of the maxillary first molars in all experimental groups at 1 and 4 weeks. BVF, bone volume fraction; Tb. Th, trabecular thickness; Tb. Sp, trabecular separation; Tb. N, trabecular number; Tb. Pf, trabecular bone pattern factor; SMI, structure model index.