
Figures & data
Figure 1. Example of driver postures while driving for a long time: Posture A (a); Posture B (b).
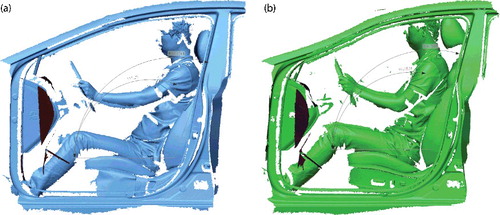
Table 1. Characteristics of muscle fiber types.
Figure 2. Oxygen concentration variation curve for the driver's lower back.
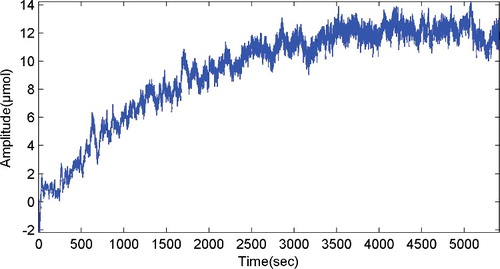
Figure 3. Driver's posture based on the seating status.
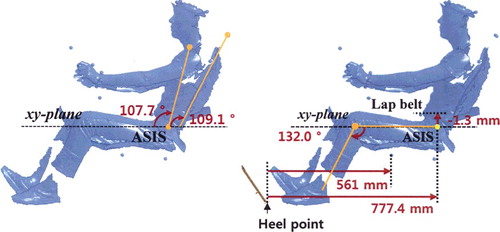
Figure 4. Mathematical model of lower-back fatigue.
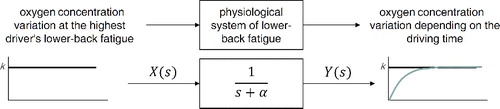
Figure 5. Oxygen concentration variation curve for the drivers in this study.
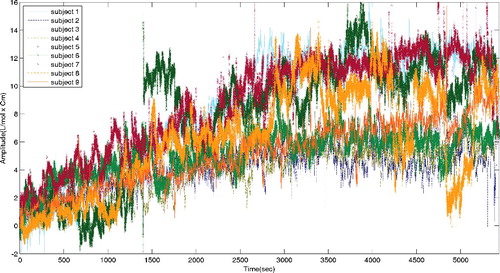
Table 2. Result of the Spearman correlation analysis to investigate the correlation between the fatigue survey results and the NIRS signal results.
Table 3. Results for the discomfort time point with the SEF90 value while driving for a long time.
Figure 6. Oxygen concentration variation curve based on the driver's posture.
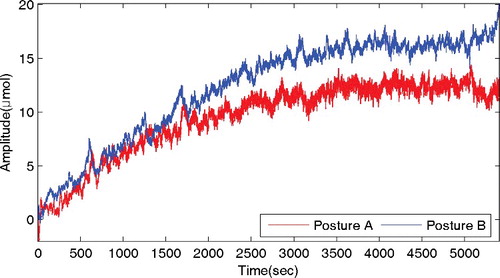
Table 4. Results for the discomfort time points on the SEF90 value based on the driver's posture.
Figure 7. Mathematical model of lower-back fatigue based on the driver's posture (Time constantT1).
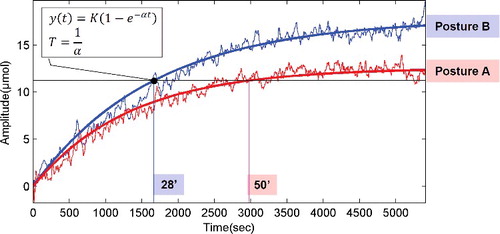
Table 5. Information pertaining to the mathematical model on lower-back fatigue (subject 10).
Table 6. Relative discomfort times in each posture for subject 10 (Time constantT1).
Figure 8. Mathematical model of lower-back fatigue based on the driver's posture (Time constantarea).
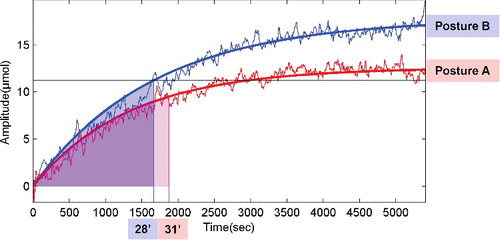
Table 7. Times of relative discomfort in each posture for subject 10 (Time constantarea).
Table 8. Result of the relative discomfort time points on drivers’ postures.