Figures & data
Figure 1. Multiple alignments of L. lactis FJNUGA01 GadB with E. coli GadB, L. plantarum Taj-Apis362 and L. brevis ATCC 367 GadB.
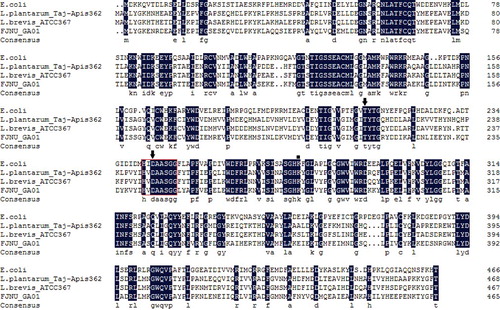
Figure 2. SDS-PAGE analysis of GAD overexpression and GABA production in recombinant E. coli by whole-cell bioconversion. (a) SDS-PAGE analysis of the expression of L. lactis FJNUGA01 GAD in E. coli. M, molecular weight markers; Lane 1, supernatant of the cell lysate from recombinant E. coli BL21 with the plasmid of pET-28a-llgadB; Lane 2, supernatant of the cell lysate from E. coli BL21 with the plasmid of pET-28a. (b) Time profiles of GABA production (square) and pH curve (triangle) of whole-cell bioconversion using 1 mol L−1 L-Glu solution as the substrate.
Figure 3. Effect of IPTG concentrations on GAD expression and GABA production. (a) SDS-PAGE analysis of GAD expression under different IPTG concentrations. M represents molecular weight markers; 1–5 represents supernatants of the cell lysate from different IPTG concentrations (0.4, 0.7, 1.0, 1.3 and 1.6 mmol l−1). (b) GABA production of whole-cell bioconversion (square) within 3 h and cell density (triangle) from different IPTG concentrations. The cells induced by different IPTG concentrations were applied as the catalysts for whole-cell bioconversion using 1 M L-Glu solution as the substrate at 45 °C. Data are presented as the mean ± SD values from three independent experiments.
Figure 4. Effect of induction temperatures on GAD expression and GABA production. (a) SDS-PAGE analysis of the GAD expression under different induction temperatures. M represents molecular weight markers; 1–5 represents supernatants of the cell extract from different induction temperatures (25, 28, 30, 33 and 37 °C). (b) GABA production of whole-cell bioconversion (square) and the supernatant of the cell lysate as the catalyst (diamond) within 3 h, and cell density (triangle) from different induction temperatures. The cells induced by different induction temperatures were applied as the catalysts for the bioconversion using 1 M L-Glu solution as the substrate at 45 °C. Data are presented as the mean ± SD values from three independent experiments.
Figure 5. Effect of induction times on GAD expression and GABA production. (a) SDS-PAGE analysis of GAD expression under different induction times. M represents molecular weight markers; 1–5 represents supernatants of the cell lysate from different induction times (10, 12, 16, 18 and 20 h). (b) GABA production of whole-cell bioconversion (square) within 3 h and cell density (triangle) from different induction temperatures. The cells induced by different induction times were applied as the catalysts for whole-cell bioconversion using 1 M L-Glu solution as the substrate at 45 °C. Data are presented as the mean ± SD values from three independent experiments.
Figure 6. Time profiles of GABA production during whole-cell bioconversion in different L-Glu concentrations. Bioconversions were performed at 45 °C using 25 g wet cell per liter (OD600 of 30). The cells induced by 1.0 mM IPTG at 30 °C for 12 h were used as the catalysts. Square, circle, up triangle and down triangle represent the concentrations of L-Glu (1, 2, 3 and 4 M), respectively. Data are presented as the mean ± SD values from three independent experiments.