Figures & data
Figure 1. Relationship between the mouse Crxos gene and the human TPRX1 gene. (A) The flanking regions around mouse Crxos gene and human TPRX1 gene. ch., chromosome. (B) Schematic diagram of the primary amino acid sequence for EGAM1 homeoproteins and TPRX1 protein. The mouse EGAM1 homeoproteins are expressed as splicing variants. Boxes filled with the same patterns indicate the regions completely matching in each protein. Tetra-peptide repeat, the protein sequence contains 58 repeated copies of a four-amino acid motif (variants of Pro-Ile-Pro-Gly).
Table 1. Sequences of primers for quantitative reverse transcription polymerase chain reaction.
Figure 2. Changes in gene expression during the progression of differentiation in human embryonal carcinoma NT2/D1 cells. (A) Cell morphology of wild-type NT2/D1 cells in an undifferentiated state (Un) and after the induction of differentiation with 10−6 mol/L retinoic acid after a 14-day culture period (D14). Low, low cell density. High, confluent. Scale bar, 100 µm. (B) The expression levels of genes encoding pluripotency factors were quantified by qRT-PCR and normalized to that of HMBS, a housekeeping gene. Data are expressed as means ± SEM (n = 3 independent dishes) and the expression levels were compared with that of cells in an undifferentiated state (Un) at low cell density. *P < 0.05. (C) The expression levels of genes encoding lineage-specific transcription factors were quantified by qRT-PCR. Data were obtained and processed as described in (B). (D) The expression levels of TPRX1 were quantified by qRT-PCR. The expression levels of exogenous TPRX1 mRNA in NT2/D1 cells transfected with a TPRX1 expression vector (+FLAG/TPRX1) were regarded as a positive control. ASCL1 for neuroectoderm; GATA6 for primitive endoderm; CDX2 for trophectoderm.
Figure 3. Enforced expression of TPRX1 protein in NT2/D1 cells. (A) Expression of FLAG-tagged TPRX1 protein (Mr, 53 kDa) in NT2/D1 cells (FLAG/TPRX1) was analyzed by Western blotting. ACTB (also known as β-ACTIN; Mr, 42 kDa) is indicated as a loading control. The numbers over the bands indicate the culture period (days) after the induction of differentiation. NT2/D1 cells transfected with an empty vector (pMN1Pur as a control) are indicated as ‘Empty.’ Un, undifferentiated state. A vertical bar on the left side of the FLAG/TPRX1 panel indicates the position of non-specific signals. (B) Subcellular localization of FLAG-tagged TPRX1 protein in TPRX1 transfectants. FLAG-tagged TPRX1 was detected using fluorescein isothiocyanate (FITC)-labeled secondary antibodies. Cell nuclei were detected using 4′,6-diamidino-2-phenylindole (DAPI). Scale bar, 50 µm. (C) Cell morphology of NT2/D1 transfected cells in an undifferentiated state (Un) and following a 14-day culture period after the induction of differentiation (D14). Scale bar, 100 µm.
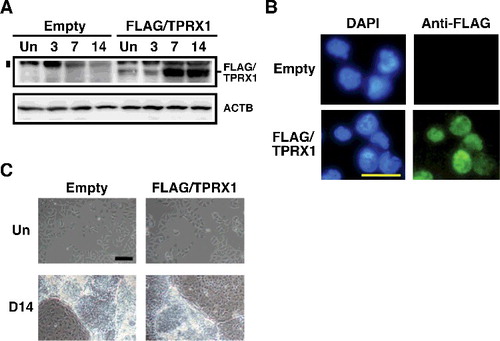
Figure 4. Changes in the expression levels of genes encoding crucial transcription factors by enforced expression of TPRX1 protein. (A) The expression levels of genes encoding pluripotency factors were quantified by qRT-PCR analysis. Data represent the sum of two independent transfection experiments, because the results obtained from trials matched well, and are expressed as means ± SEM (n = 6 independent dishes). *P < 0.05. (B) qRT-PCR analysis of lineage-specific transcription factors (n = 6 independent dishes). *P < 0.05. ASCL1 for neuroectoderm; T for mesoderm; GATA6 and FOXA2 for primitive endoderm; CDX2 and EOMES for trophectoderm.