Figures & data
Table 1. Different Pyrus accessions and their species used in this study.
Table 2. SSR primer sequences that were used to study Pyrus genetic diversity.
Table 3. Dice similarity coefficient among 47 Pyrus accessions obtained from SSR markers. Numbers in the first column and the first line represent different accessions according to .
Table 4. Number of alleles and private alleles observed in different species of Pyrus in this experiment.
Figure 1. Genetic structure of 47 pear accessions obtained from STRUCTURE analysis. (A) Results of Structure Harvester representing K = 3 as the best numbers of groups according to the delta K method. (B) Pattern of accession assignments into three different groups using the STRUCTURE model. Different colour of each vertical line represents the percent of membership (vertical values on the left of cluster) of each individual for three groups. Numbers at the bottom represent the samples based on .
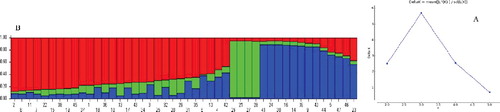
Figure 2. Principal coordinates of 47 accessions based on eight SSR loci.
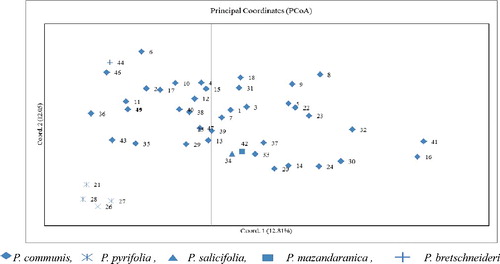
Figure 3. Dendrogram of five Pyrus species according to Nei's genetic identity depicted by Mega 6 software.
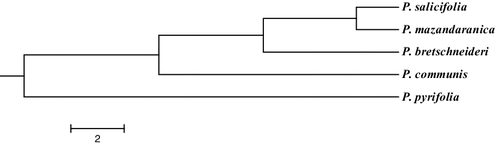
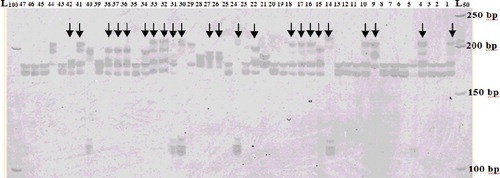
Figure 4. Banding patterns generated by using CH04e03 SSR marker showing duplication in some accessions.