Figures & data
Figure 1. Ultraviolet–visible (UV-vis) spectra of silver nanoparticles as a function of time at intervals of 15, 30, 45 and 60 min.
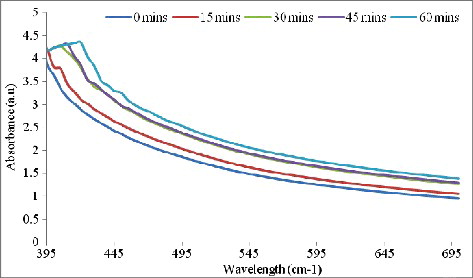
Figure 2. Scanning electron micrograph and energy dispersive absorption spectra of nanoparticles derived from the spice blend.
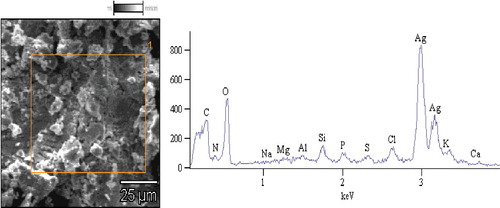
Figure 3. Transmission electron microscopy micrographs of silver nanoparticles from the spice blend.
Figure 4. Fourier transform infrared (FTIR) spectrum of silver nanoparticles from the spice blend.
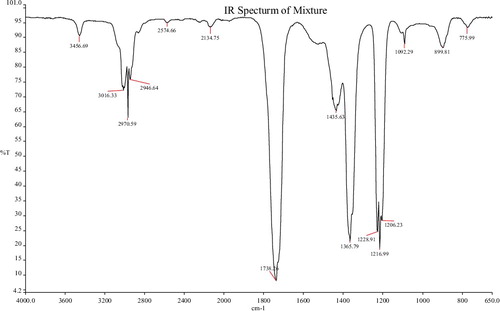
Figure 5. X–ray diffraction pattern of silver nanoparticles from the spice blend.
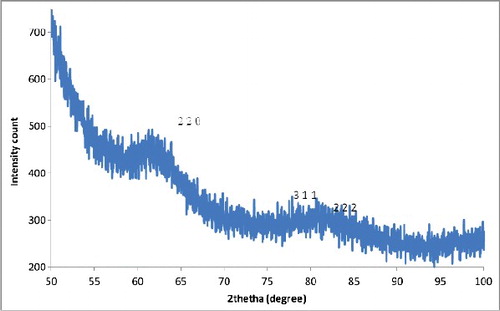
Table 1. Powder diffraction pattern and Miller indices (h k l) of the spice blend nanoparticles.
Figure 6. Minimum inhibitory concentration (MIC, µg/mL) of silver nanoparticles from the spice blend against bacterial isolates.
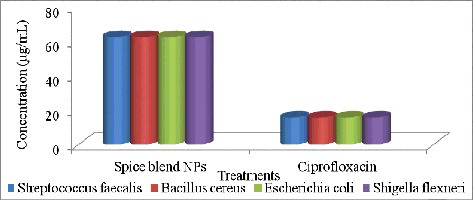
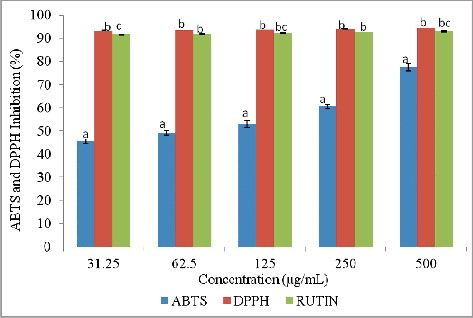
Figure 7. Inhibition of ABTS and DPPH radicals by the spice blend silver nanoparticles.