Figures & data
Figure 1. Construction of pBI–LFchimera-HIS expression vector for LFchimera expression in tobacco. (A) oligonucleotide sequence of native and plant optimized LFchimera. The 6 × His tag and the ER-retention signal KDEL were fused at the C-terminus in-frame with the LFchimera CDS. (B) Plasmid pBI121 contained the nptII (kanamycin-resistance) gene under the control of the nopaline synthase (NOS) gene promoter and a codon-optimized LFchimera under the control of the CaMV 35S promoter and with a NOS terminator. RB, T-DNA right border; LB, T-DNA left border.
Figure 2. Screening transgenic plants. (A) PCR amplification of a 197-bp fragment of LFchimera using DNA derived from N. tobacco plants; Lane M, Ruler 1-kb DNA Ladder Mix (Fermentas, Germany); Lanes 1–5, transgenic plant lines; lane P, positive control (A. tumefaciens culture); Lane C, PCR negative control (water); and Lane NT, non-transgenic plant line. (B) RT-PCR analysis of LFchimera in NT and transgenic plants. The NtEF1a gene was used as a control.
Figure 3. Expression and partial purification of recombinant LFchimera from plant total soluble protein. Tricine SDS-PAGE (16.5%) showing recombinant peptide and purification profile of LFchimera. Lane M, molecular weight marker (Fermentas); Lane 1, total protein from the NT plant; Lane 2, total protein from the T3 transgenic plant; and Lane 3, purified LFchimera using the affinity column.
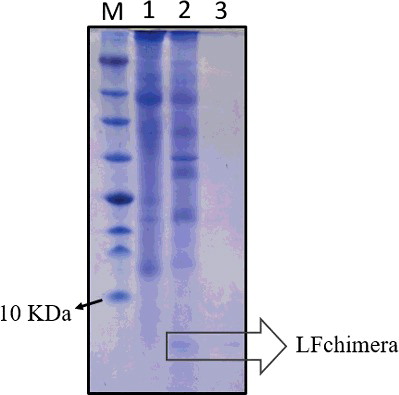
Figure 4. Antimicrobial activity of tobacco leaf extracts on clinical and phytopathogenic bacteria growth.
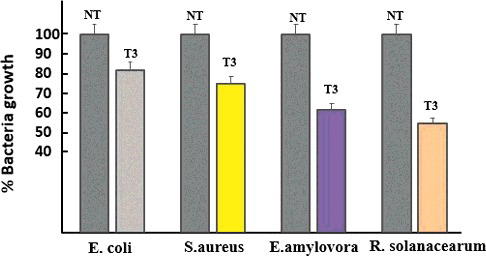
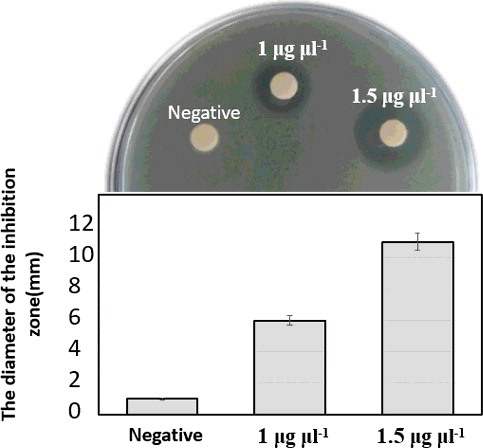
Figure 5. Antibacterial activity of purified peptide against E. coli, assayed using the disc-diffusion method.