Figures & data
Table 1. CpG island-rich region in the promoter for specific amplification of human Id2 gene.
Table 2. Basic characteristics and clinical data of TOF and control subjects.
Figure 1. Id2 gene sequence analysis indicating CpG islands.
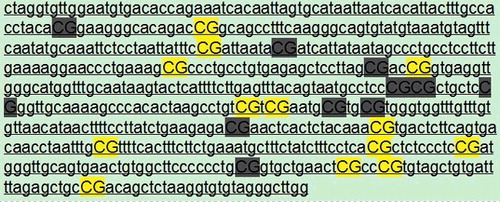
Figure 2. Cluster analysis of 13 detectable CpG sites of the Id2 gene.
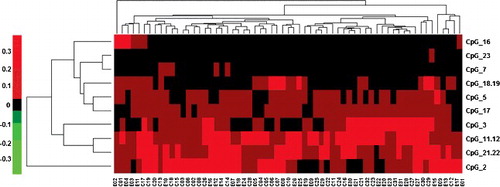
Figure 3. Methylation sequencing of Id2_CpG sites.
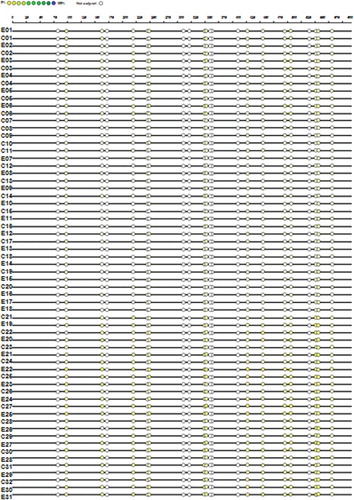
Table 3. Comparison of methylation levels at Id2_GpG sites.
Figure 4. Correlation between the serum content of MCH and the methylation level at the Id2_CpG_16 site.
Figure 5. Correlation between the serum content of MCHC and the methylation level at the Id2_CpG_16 site.
Figure 6. Correlation between the serum content of MCH and the methylation level at Id2_CpG_18.19 site.
Figure 7. Correlation between the serum content of MCHC and the methylation level at Id2_CpG_18.19 site.