
Figures & data
Table 1. Year of EU marketing authorisation, inclusion in PDL and percentage of reimbursement.
Figure 1. Utilization of COPD INNs in DDD.
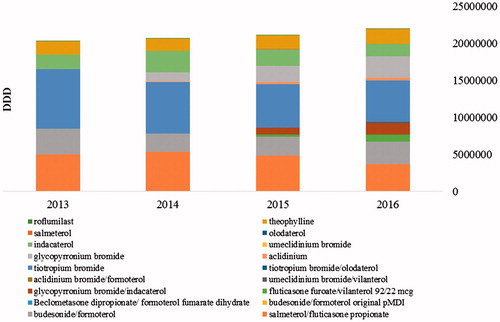
Table 2. Number of utilized DDDs per INNs and therapeutic groups.
Figure 2. Average annual variation rate (AAVR) of the DDDs utilization for the observed period. *AAVR was not calculated due to lack of data for more than 1 year.
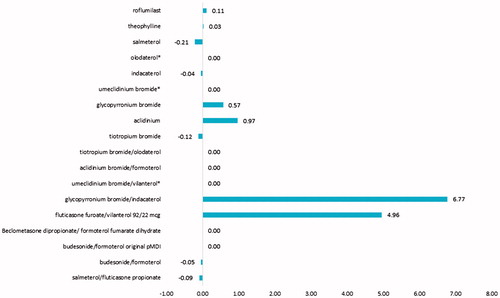
Table 3. Patients’ characteristics.
Figure 3. Average number of exacerbations requiring hospitalization according to type of therapy and severity of disease.
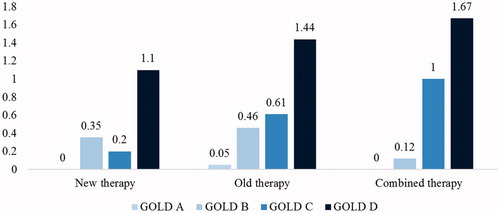
Figure 4. Regression model of the correlation between the number of hospitalizations and their cost (in BGN) for the observed period.
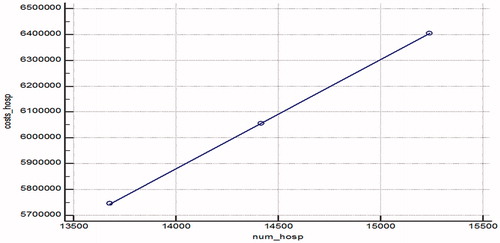
Figure 5. Regression model of the correlation between DDD of LABA/LAMA and LABA utilized and the number of hospitalizations for the observed period.
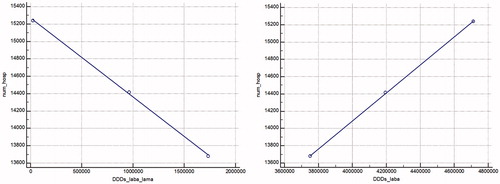
Table 4. Regression equation of the correlation between the number of hospitalizations and the DDD utilization of the different therapeutic groups.
Table 5. Statistical analysis and Kruskal–Wallis results for exacerbation, broken down by disease stage.