Figures & data
Figure 1. Quantities of biomass and exopolysaccharide synthesized by Antarctic strains.
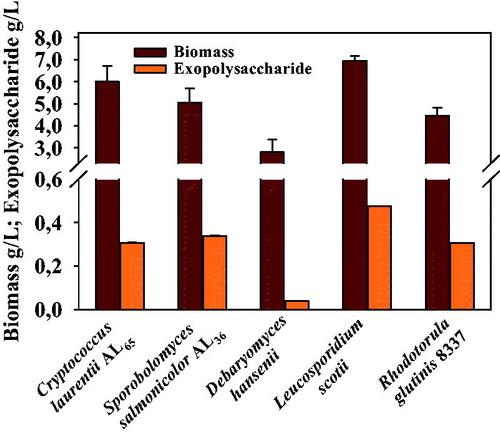
Figure 2. 1H NMR spectra of extracted metabolites. D. hansenii (1); L. scotii (2); C. laurentii (3); S. salmonicolor (4); and R. glutinis (5).
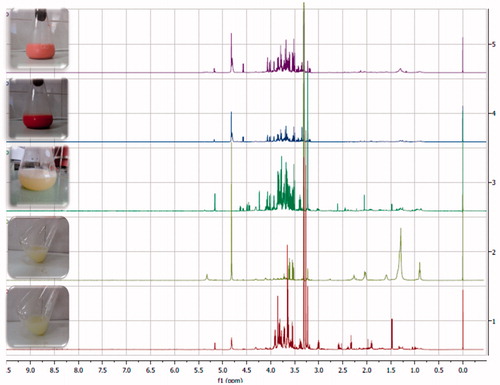
Table 1. 1H NMR chemical shifts (δ, ppm) and coupling constant (J, Hz) identified by relevant 1H NMR and 2D NMR spectra.
Figure 3. PCA score plots (at 95% confidence level of 20 spectra peak tables).
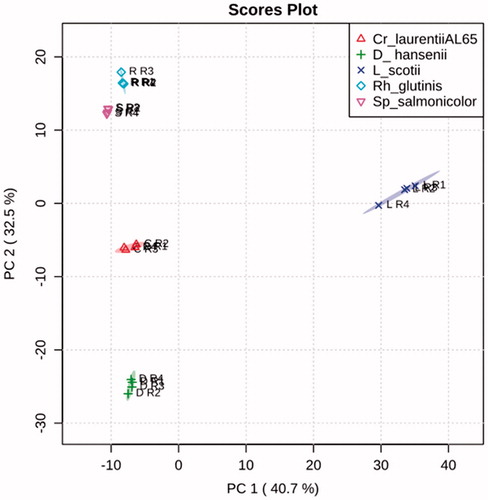
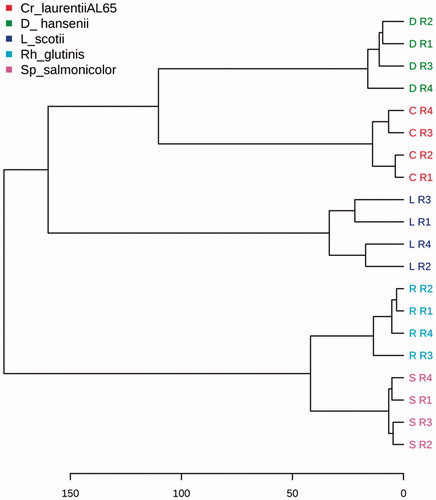
Figure 4. HCA Dendograms of 20 spectral peak tables. Note: Euclidean distance and minimum variance linkage method (Ward’s) are used.