Figures & data
Table 1. RT-qPCR primer sequences.
Figure 1. Cell proliferation analysis on days 1, 3 and 5 of neural progenitor C17.2 cells cultured in proliferation culture medium with three different venom concentrations. Effect of crude venom concentration (a) and incubation time (b).
Note: Mean values; error bars represent ± SD (n = 6). *P < 0.05, **P < 0.01, ***P < 0.001.
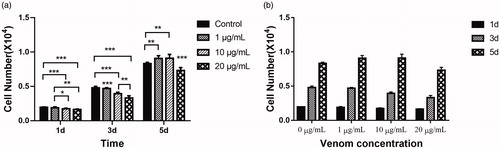
Figure 2. Morphology of neural progenitor C17.2 cells cultured in proliferation medium (a–d) or differentiation medium (e–h) for 6 days. Control cells (a), cells exposed to 1 μg/mL (b), cells exposed to 10 μg/mL (c) and cells exposed to 20 μg/mL (d) of crude venom dissolved in the proliferation medium. Control cells (e), cells exposed to 1 μg/mL (f), cells exposed to 10 μg/mL (g) and cells exposed to 20 μg/mL (h) of crude venom dissolved in differentiation medium.
Note: Phase contrast images. Scale bar 100 μm.
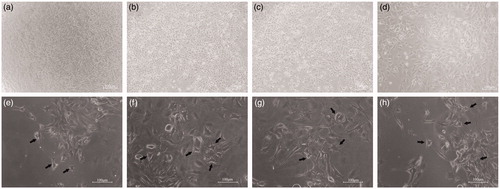
Figure 3. Effects of venom on differentiation of neural progenitor cells. β-Tubulin III (green) and nuclei (blue) in control cells (a–c), cells exposed to 1 μg/mL (d–f), cells exposed to 10 μg/mL (g–i) and cells exposed to 20 μg/mL (j–l) of crude venom. Note: Immunofluorescence images. Scale bars: 200 μm. C17.2 cells were exposed to either 1, 10 or 20 μg/mL of C. jingzhao crude venom in differentiation medium for 10 days.
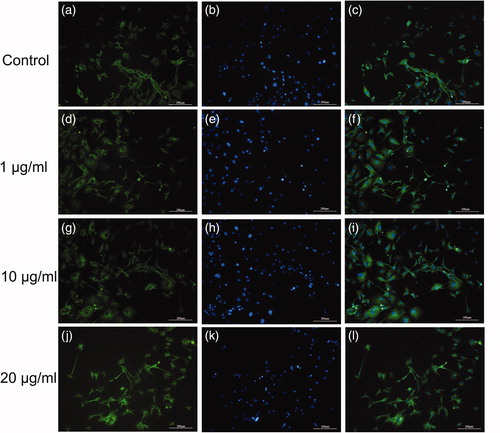
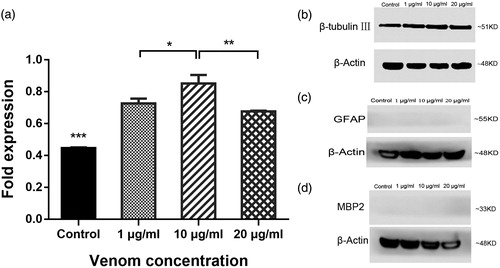
Figure 4. Effects of venom on expression levels of neuronal biomarkers in vitro. mRNA levels of β-tubulin III after 10 days differentiation and crude venom exposure (a). Specific gene expression determined by RT-PCR (b). Note: C17.2 cells were exposed to 1, 10 or 20 μg/mL of C. jingzhao crude venom in differentiation medium for 10 days. Error bars represent means ± SD (n = 3). ***P < 0.001.
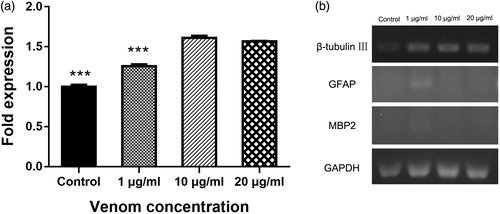
Figure 5. Effects of C. jingzhao crude venom on expression levels of neuronal biomarkers in vitro. Protein levels of β-tubulin III in response to differentiation and crude venom exposure (a). Representative Western blot staining for β-tubulin III (b), GFAP (c), MBP2 (d) and the loading control β-actin. Note: C17.2 cells were exposed to 1, 10 or 20 μg/mL of venom during 10 days of differentiation. Error bars represent means ± SD (n = 3) *P < 0.05, **P < 0.01, ***P < 0.001.