
Figures & data
Figure 1. Relative expression levels of groES in B. subtilis WB600-pHY-WZX and WB600-pHY-groES determined by qRT-PCR. Note: The relative transcription levels of groES were normalised to the transcription level of the 16S rRNA gene. The presented values are averages of three independent experiments. The error bars indicate standard deviations.
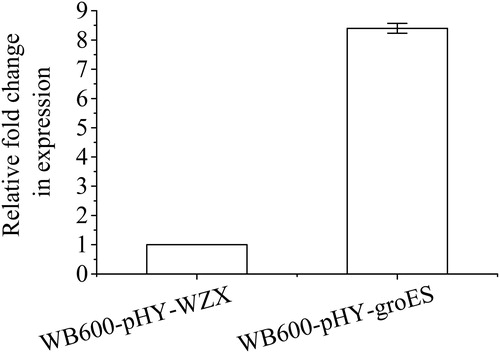
Figure 2. Growth phenotype of transformants containing plasmids pHY-groES or pHY-WZX after exposure to different temperatures. Note: Exposure to different temperatures for 1 h, 10-fold serial dilution and cultivation at 37 °C for 12 h.
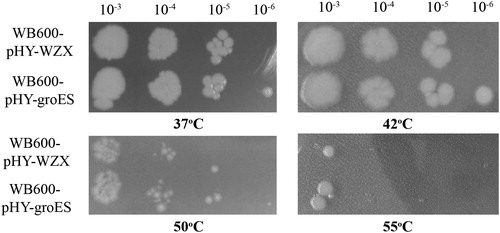
Figure 3. Growth profiles of B. subtilis WB600-pHY-WZX and WB600-pHY-groES cultured at 37 °C (a), 42 °C (b), 50 °C (c), and 55 °C (d) for 12 h. Filled square and unfilled circle represent B. subtilis WB600-pHY-WZX and WB600-pHY-groES, respectively.
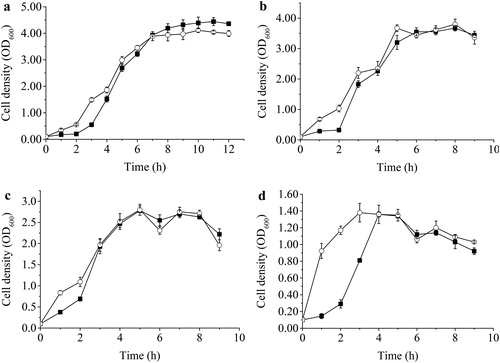
Table 1. Doubling time of B. subtilis WB600-pHY-WZX and WB600-pHY-groES cultured at different temperatures.