Figures & data
Table 1. Adjusted formulations of NSTC samples based on uniform design.
Table 2. Peak areas of 10 compounds in the HPLC fingerprint of NSTC samples.
Table 3. Effects of nine NSTC samples on haemorheological parameters.
Table 4. Total variance explained by components X1–X4.
Table 5. Rotated component matrix.
Table 6. Scores of components.
Table 7. Chi-square test results.
Table 8. CCA model between compounds and effects.
Table 9. Corelation between parameters and components.
Figure 1. HPLC fingerprints of NSTC samples.
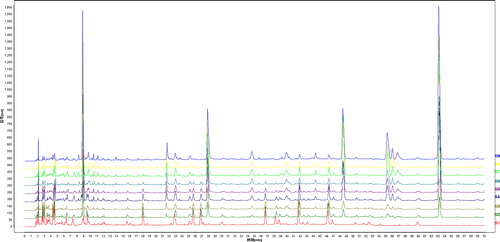
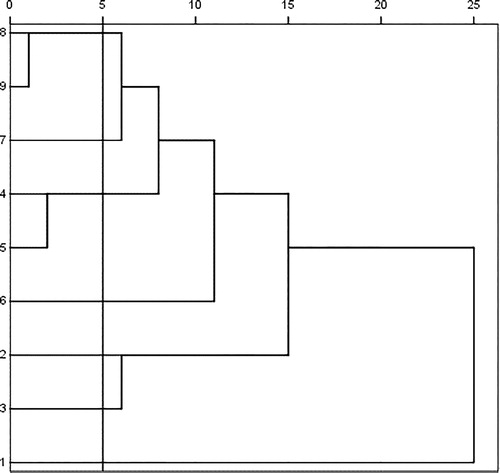
Figure 2. Cluster analysis of NSTC samples.