Figures & data
Table 1 Primers for qRT-PCR of CsLBD genes.
Table 2 Regular expression levels of conserved motifs from CsLBD proteins
Figure 1. Conserved motif compositions of CsLBD proteins.
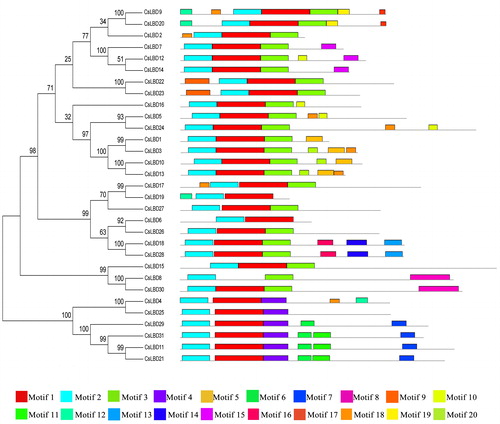
Figure 2. Phylogenetic tree of LBD proteins form C. sinensis and A. thaliana.
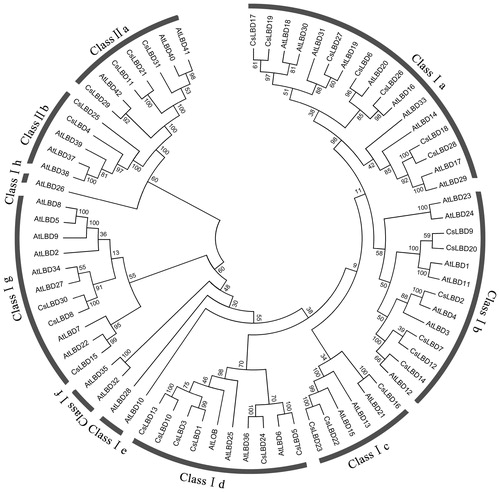
Figure 3. Comparisons of LBD TFs in different species.
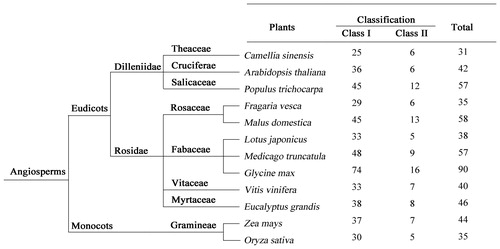
Figure 4. Interaction networks of LBDs in C. sinensis according to the orthologs in Arabidopsis.
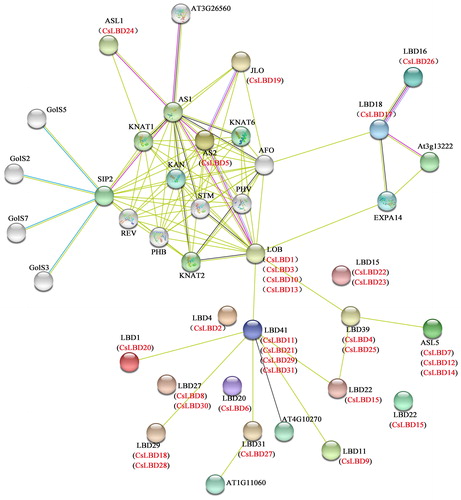
Figure 5. Expression profiles of selected CsLBD genes in different tissues of the tea plant cultivar ‘Longjing43’.
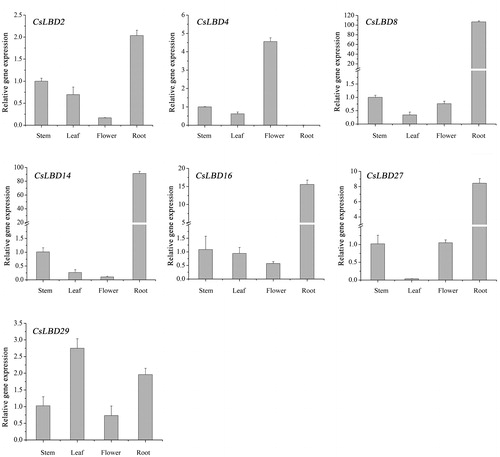
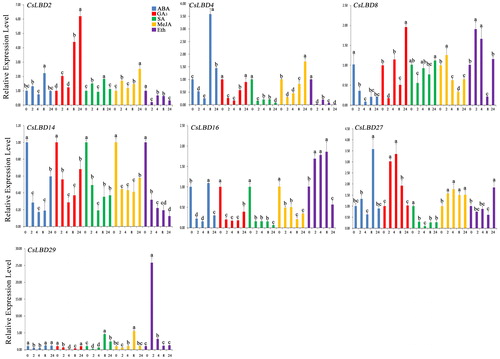
Figure 6. Expression profiles of CsLBD genes in the tea cultivar ‘Longjing43’ under hormone treatments: ABA (0.1 mmol/L), GA3 (1 mmol/L), SA (1 mmol/L), MeJA (1 mmol/L), Eth (0.1 mmol/L). Note: Error bars represent standard deviation (±SD). The values indicated by different letters significantly differ at P < 0.05.