Figures & data
Table 1. Primers used in the present study.
Figure 1. Bioinformatics analysis of KvNHX1. (a) Conserved domain analysis of KvNHX1. (b) Hydrophilic analysis of KvNHX1. TM1–TM11 represent transmembrane helices. (c) Alignment of KvNHX1 protein sequences with homologous sequences of other species. TM1–TM11 transmembrane domains of KvNHX1 are shown by thick lines above the sequences and the amiloride-binding domain is framed with a red box in TM3. The accession numbers of the protein sequences were as follows: GhNHX1 (NP_001313722.1), DzNHX2 (XP_022718946.1), CcNHX1 (AAT36679.1), HuNHX2 (XP_021281573.1), TcNHX (EOY10658.1), JcNHX2 (XP_012089169.1), PeNHX (AQN76291.1). (d) Phylogenetic analysis of KvNHX1. The accession numbers of the protein sequences were as follows: GhNHX1 (NP_001313722.1), CcNHX1 (AAT36679.1), DzNHX2 (XP_022718946.1), HuNHX2 (XP_021281573.1), TcNHX (EOY10658.1), GmNHX (AAR27596.1), JcNHX2 (XP_012089169.1), RcNHX2 (NP_001310702.1), PeNHX (AQN76291.1), PtNHX1 (AAV84586.1).
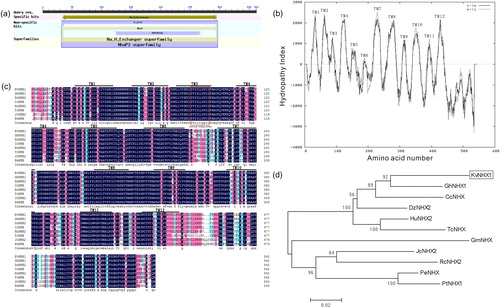
Figure 2. Expression analysis of KvNHX1 in leaves of Kosteletzkya virginica seedlings under abiotic stress by qRT-PCR. (a) 300 mmol L−1 NaCl treatment. (b) 100 μmol L−1 ABA treatment. (c) 15% PEG 6000 treatment. Note: Each data point represents the average of three replications and the error bars represents standard deviations based on three replications.
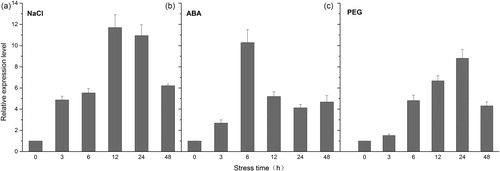
Figure 3. DNA-PCR (a), RT-PCR (b) and qRT-PCR (c) detection for T0-generation transgenic lines. M, DNA Marker (Trans2K Plus, TransGen Biotech); WT, wild type; N1–N10, different transgenic lines.
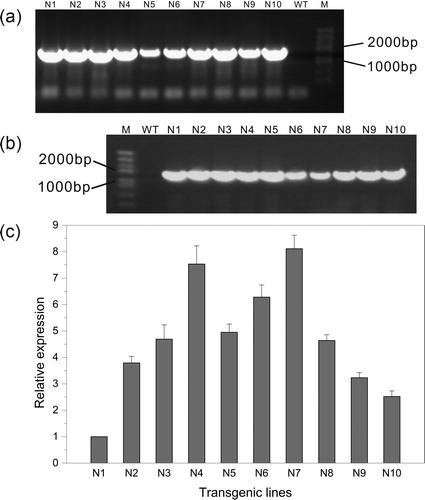
Figure 4. Chlorophyll content (a), fresh weight (b) and dry weight (c) in WT and transgenic lines.
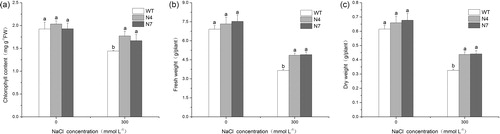
Figure 5. Proline content (a), MDA content (b) and the activities of SOD (c) and POD (d) in WT and transgenic lines.
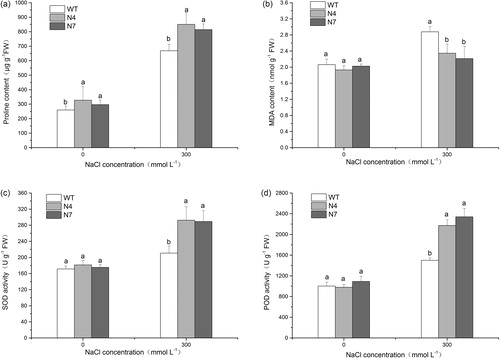
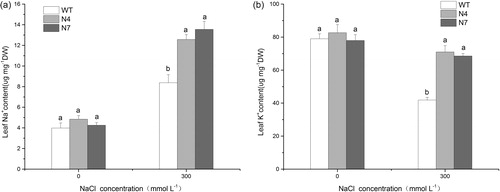
Figure 6. Na+ content (a) and K+ content (b) in WT and transgenic lines.