Figures & data
Figure 1. Effects of ginsenoside CK on the neurobehavioural score and brain water content in rats. Note. Values are means ± SD (n = 6). Compared with the Sham group, **P < 0.01; compared with the I/R group, # P < 0.05, ##P < 0.01.
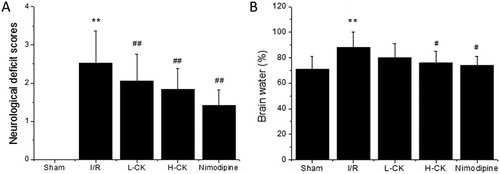
Figure 2. Effect of ginsenoside CK on the infarct volume ratio of rats. Note: Values are means ± SD (n = 6). Compared with the Sham group, **P < 0.01; compared with the I/R group, # P < 0.05, ##P < 0.01.
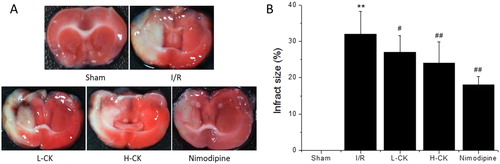
Figure 3. Antioxidant effect of ginsenoside CK in the brain tissue of rats. Note: Values are means ± SD (n = 6). Compared with the Sham group, **P < 0.01; compared with the I/R group, # P < 0.05, ##P < 0.01.
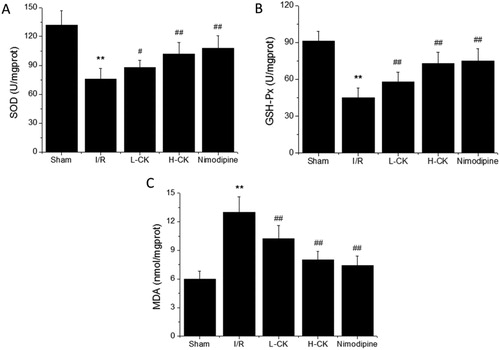
Figure 4. Effect of ginsenoside CK on the inflammation of brain tissue of rats. Note: Values are means ± SD (n = 6). Compared with the Sham group, **P < 0.01; compared with the I/R group, # P < 0.05, ##P < 0.01.
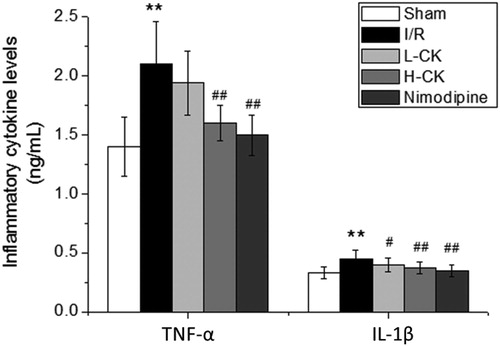
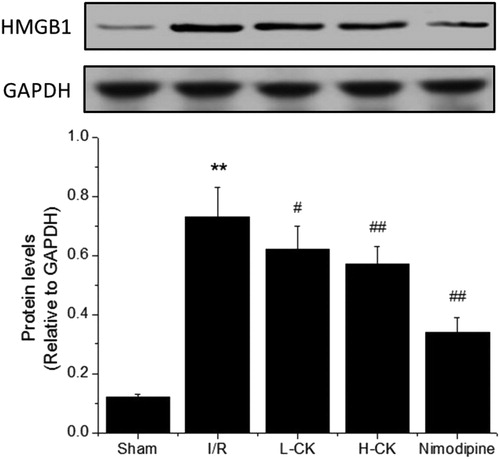
Figure 5. Effect of ginsenoside CK on the expression of HMGB1 in the brain tissue of rats. Note: Values are means ± SD (n = 6). Compared with the Sham group, **P < 0.01; compared with the I/R group, # P < 0.05, ##P < 0.01.