
Figures & data
Figure 1. A perspective view of a single circular tray SSB from a side view, with emphasis on the location of the tray.
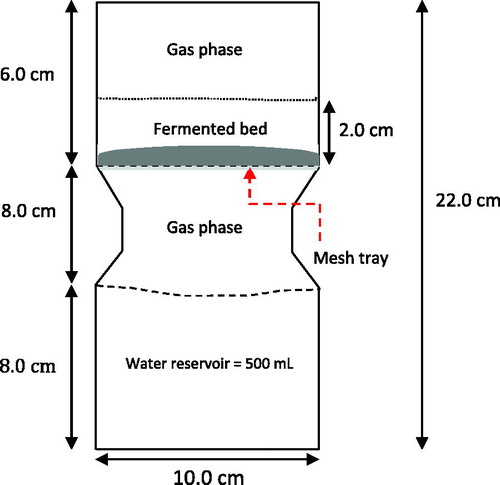
Figure 2. A schematic diagram of experimental set-up of the single circular tray SSB.
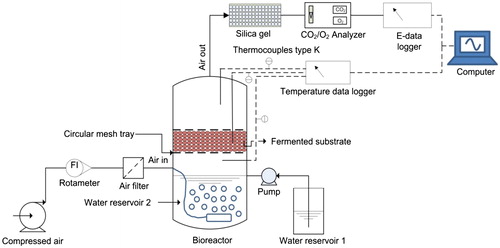
Table 1. Operating conditions of the solid state tray bioreactor.
Table 2. Air arrangement in single circular tray SSB.
Figure 3. Profile of final moisture content at 72 h for control experiment (uninoculated wheat bran: □), fermented wheat bran with A. awamori (▪) and A. oryzae (
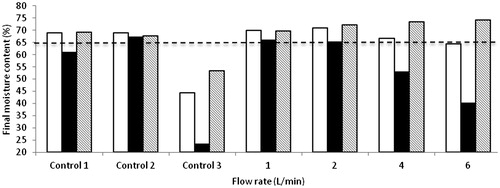
Figure 4. Variation of cumulative CO2 evolved with time at different air flow rate during the growth of A. awamori [AA] and A. oryzae [AO] on wheat bran in single circular tray SSB. Symbols represent experimental data. The Gompertz model is shown as a solid line.
![Figure 4. Variation of cumulative CO2 evolved with time at different air flow rate during the growth of A. awamori [AA] and A. oryzae [AO] on wheat bran in single circular tray SSB. Symbols represent experimental data. The Gompertz model is shown as a solid line.](/cms/asset/19c1c7a8-b1bf-4d5d-8793-26a38c18de58/tbeq_a_1530950_f0004_c.jpg)
Table 3. Kinetics constants for different air flow rate according to Gompertz model.
Figure 5. Correlation between measured and predicted data of A. awamori and A. oryzae from all experiments conducted using wheat bran in single circular tray SSB.
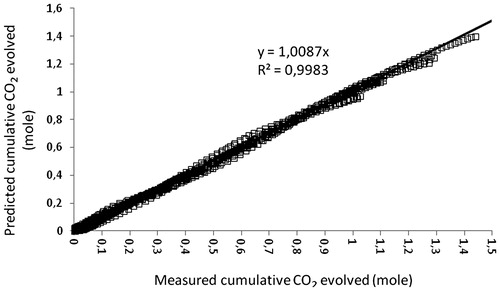
Figure 6. Profiles of RQ in single circular tray SSB systems with the fungi A. awamori [AA] and A. oryzae [AO] with different air arrangements. The straight line represents RQ =1.
![Figure 6. Profiles of RQ in single circular tray SSB systems with the fungi A. awamori [AA] and A. oryzae [AO] with different air arrangements. The straight line represents RQ =1.](/cms/asset/4b2389f2-28cf-42a0-ac2d-3e5f14fb6784/tbeq_a_1530950_f0006_c.jpg)
Figure 7. Respiratory quotient (RQ) during SSF of A. awamori (▪) and A. oryzae (□) on wheat bran using single circular tray SSB with different air arrangements. The dashed line represents RQ =1.
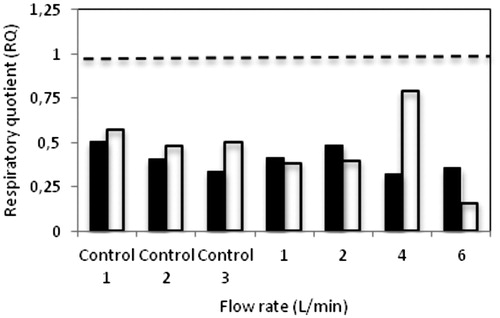
Figure 8. Relationship between RQ with [] obtained from every air arrangement using single circular tray systems with A. awamori and A. oryzae cultures.
![Figure 8. Relationship between RQ with [CO2max] obtained from every air arrangement using single circular tray systems with A. awamori and A. oryzae cultures.](/cms/asset/e60bbd04-4fef-438d-b2b9-0dd9900fcaba/tbeq_a_1530950_f0008_b.jpg)
Figure 9. Effect of the different air flow rate on the heat evolution of A. awamori [AA] and A. oryzae [AO] grown on wheat bran performed in single circular tray.
![Figure 9. Effect of the different air flow rate on the heat evolution of A. awamori [AA] and A. oryzae [AO] grown on wheat bran performed in single circular tray.](/cms/asset/e1245f0e-a3ff-4402-a01c-05287c4c9115/tbeq_a_1530950_f0009_c.jpg)