Figures & data
Figure 1. Map of sampling stations.
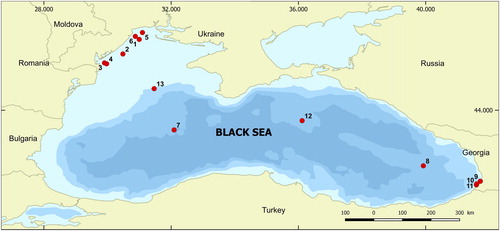
Table 1. Number of OTUs and MPSs in the samples.
Figure 2. Rarefaction curves showing the relationship between the numbers of MPSs and OTUs.
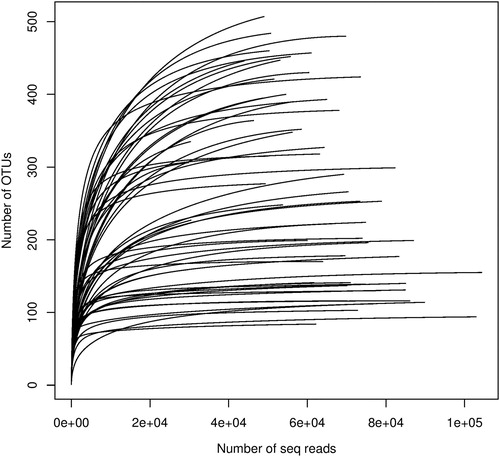
Figure 3. Frequency distributions for the BLAST top hit similarities with the closest reference sequences in the international nucleotide sequence databases (INSDs) for the number of OTUs and MPSs.
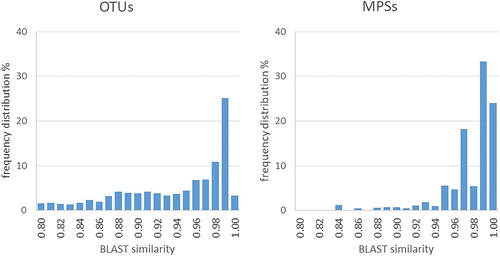
Figure 4. The relative abundance of phytoplankton (OTUs and MPSs) at a class level.
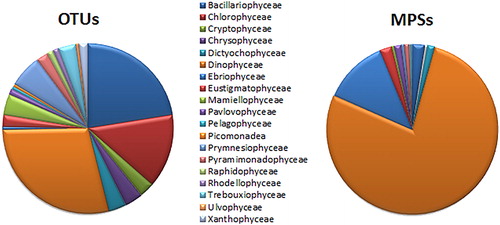
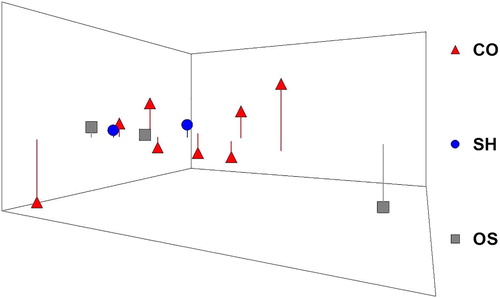
Figure 5. nMDS (3D) plot of sequences (taxa) distribution in the surface sediments from the three different “habitats” in the Black Sea sampled in May–June 2016 (stress 0.06): CO, coastal; SH, shelf; OS, open sea (Map of stations in Figure 1).