
Figures & data
Figure 1. Loading of curcumin (µg/mL micellar dispersion) depending on the loading method and Pluronic® type.
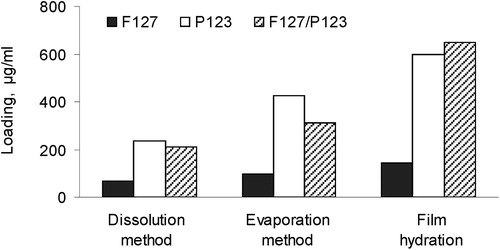
Table 1. Size and zeta-potential of the developed micelles loaded with CRM.
Figure 2. In vitro release of curcumin in a phosphate buffer.
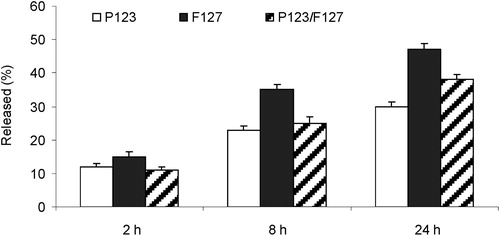
Figure 3. Effect of single drugs on colony formation.
Note: CRM-Et, ethanol solution of curcumin; MLT, miltefosine; ERF, erufosine.
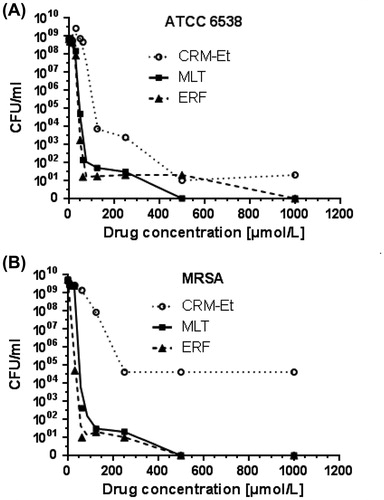
Table 2. Antibacterial activity of examined drugs against MSSA and MRSA.
Figure 4. Redox activity of S. aureus strains after single drug treatment – MM modified model.Note: NEA, normalized enzyme activity, [%]; Vm, overall normalized maximum enzyme activity, [%]; Ki, inhibition constant, [µmol/L]; R, correlation coefficient, [-].
![Figure 4. Redox activity of S. aureus strains after single drug treatment – MM modified model.Note: NEA, normalized enzyme activity, [%]; Vm, overall normalized maximum enzyme activity, [%]; Ki, inhibition constant, [µmol/L]; R, correlation coefficient, [-].](/cms/asset/af94cf7e-7efc-4643-9215-344e9ed290a4/tbeq_a_1533792_f0004_c.jpg)
Figure 5. Redox activity of S. aureus strains after single drug treatment – LP model.
Note: NEA, normalized enzyme activity; [%]; Dose, concentration of drug, [µmol/L]; P1, inhibitory constant, which may be interpreted IC50 in medical studies or as the dose achieving 50% inhibition, [µmol/L]; P2, slope, [-]; R, correlation coefficient, [-].
![Figure 5. Redox activity of S. aureus strains after single drug treatment – LP model.Note: NEA, normalized enzyme activity; [%]; Dose, concentration of drug, [µmol/L]; P1, inhibitory constant, which may be interpreted IC50 in medical studies or as the dose achieving 50% inhibition, [µmol/L]; P2, slope, [-]; R, correlation coefficient, [-].](/cms/asset/8ef5ee65-c3ec-458b-9b26-399342bf8dfc/tbeq_a_1533792_f0005_c.jpg)
Figure 6. Quantitative biofilm evaluation after treatment with ethanol solution of curcumin, curcumin-loaded micelles, miltefosine and erufosine.
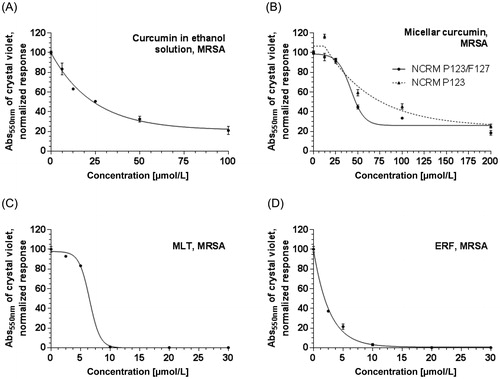
Figure 7. Biofilm formation of MRSA after treatment with curcumin (in the form of ethanol solution or nano-micelles) and alkylphosphocholines: microscopic documentation of the biofilm inhibition.
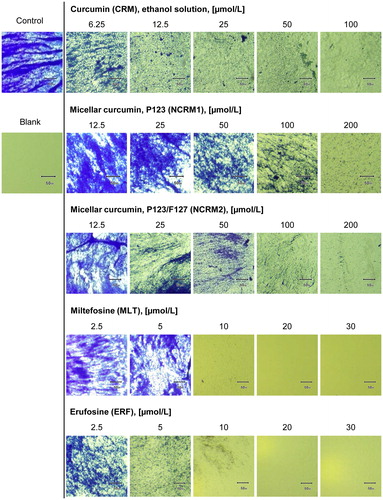
Table 3. Antibacterial activity of drug combinations.