Figures & data
Table 1. Primers used in this study.
Figure 1. Nucleotide and deduced amino acid sequences of CsMADS02. (A) CDS of CsMADS02 and its deduced amino acids. The MADS domain and K-box are underlined in red and blue, respectively. The stop codon TGA is marked with an asterisk. (B) Exon–intron structure of CsMADS02 analyzed by the online GSDS tool. Exons and introns are shown by rectangles and lines, respectively.
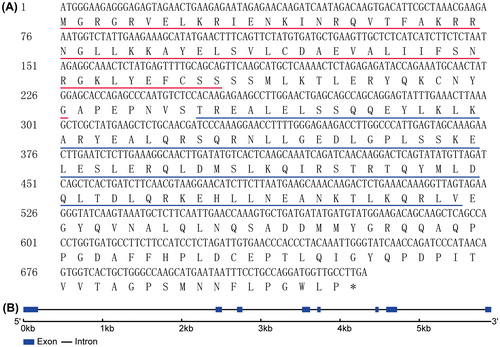
Figure 2. Comparison of the deduced amino acids of CsMADS02 with those of SEP proteins from other plant species. Note: The MADS-box, K-box, I region and C region are underlined. Two SEP motifs I and II are boxed. Accession numbers of these proteins are listed as follows: AtSEP3, AEE30503.1; TaMADS1, AAQ11687.1; GmMADS28, NP_001236390.1; OsMADS1, ABF94637.1; GbSEP, AIC79629.1; ZjMADS47, XP_015894301.1; and SlCMB1, XP_004237061.1.
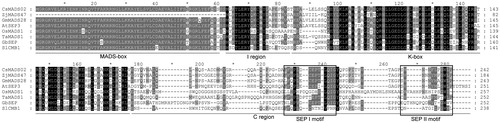
Figure 3. Phylogenetic analysis of CsMADS02 and 33 other SEP proteins from various plant species. CsMADS02 is marked in bold. The accession numbers of SEP proteins used for phylogenetic tree analysis are shown in Supplementary material Table S1.
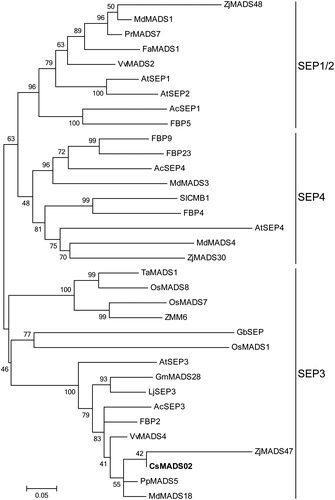
Figure 4. Predicted promoter cis-elements of CsMADS02 gene. Note: The putative cis-elements involved in developmental processes, abiotic stress and hormones are boxed in different colours. The transcription start site is marked with pink and designated as +1 position.
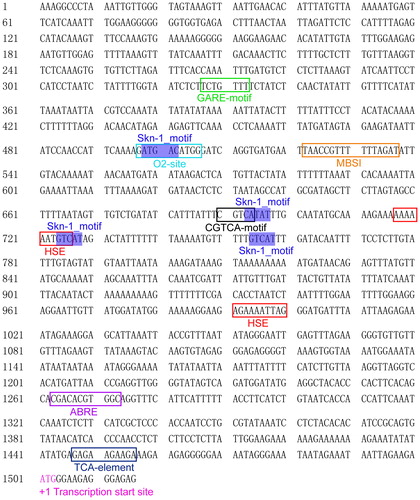
Figure 5. Expression levels of CsMADS02 in 10 different tissues of cucumber by transcriptome data. Note: The expression values are indicated as the FPKM values with no replication.
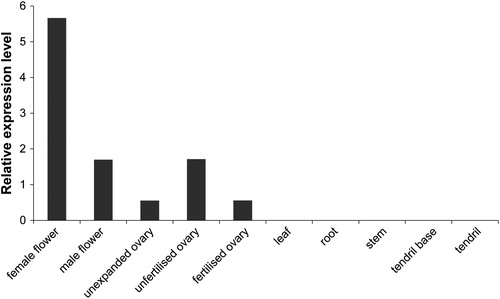
Figure 6. RT-PCR analysis of expression profiles of CsMADS02 during flower development in cucumber. Note: MF1/FF1 to MF5/FF5 were divided based on the corolla length. MF1/FF1 = (2.5 ± 1) mm, MF2/FF2 = (5 ± 1) mm, MF3/FF3 = (9 ± 2) mm, MF4/FF4 = (15 ± 2) mm, MF5/FF5 = (20 ± 2) mm. MF, male flowers. FF, female flowers.
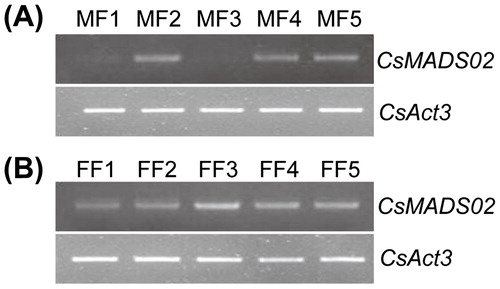
Figure 7. Overexpression construct of the binary vector pHB::CsMADS02 and RT-PCR detection of transgenic Arabidopsis. (A) Schematic diagram of the T-DNA region of pHB::CsMADS02 overexpression construct. (B) RT-PCR analysis of CsMADS02 expression in two transgenic lines (OE1 and OE2) and WT plants using the AtTubulin4 gene as a reference.
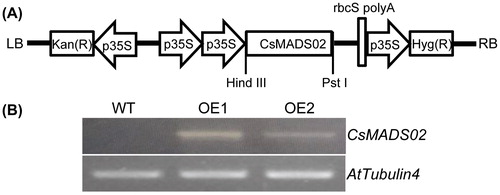
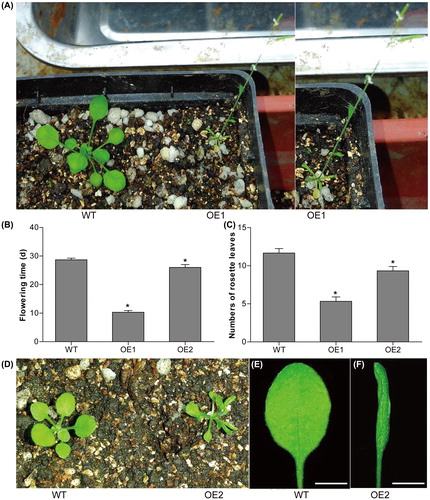
Figure 8. Phenotypes of CsMADS02 transgenic Arabidopsis plants. (A) WT and OE1 Arabidopsis. (B) Flowering time determination of two transgenic lines (OE1 and OE2) and WT plants. (C) Numbers of rosette leaves in two transgenic lines (OE1 and OE2) and WT plants. * Represents significant differences from the WT at values of P < 0.05, as determined by Student’s t-test. (D) WT and OE2 Arabidopsis. (E and F) Leaves of WT (E) and OE2 (F) from (D). Bar = 0.5 cm.