Figures & data
Figure 1. 1H-NMR spectra of PEO113-C≡CH (A), N3-PCL35-N3 (B) and PEO113-b-PCL35-b-PEO113 triblock copolymer (C) in CDCl3.
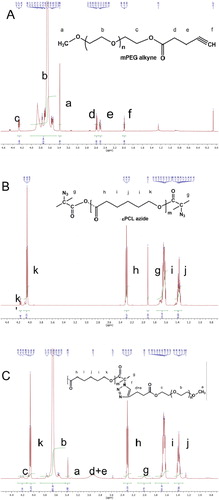
Figure 2. GPC chromatograms of PEO113-b-PCL35-b-PEO113 triblock copolymer and the two macroreagents.
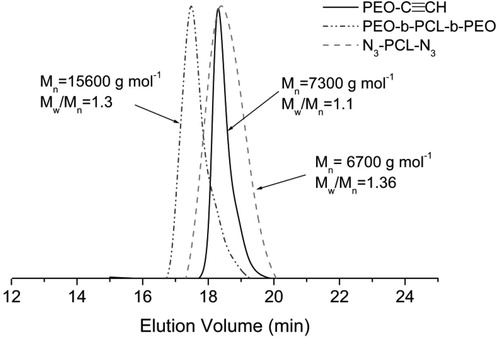
Figure 3. Sketch of the formation of CAPE-loaded PEO-b-PCL-b-PEO micelles (top) and hydrodynamic diameter distribution of empty and CAPE-loaded micelles obtained by DLS (bottom).
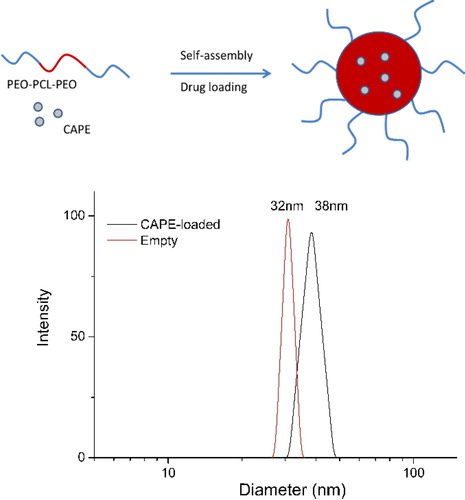
Figure 4. Representative 3D AFM height image of CAPE-loaded micelles (A) and cross-section through one of the micelles (B).
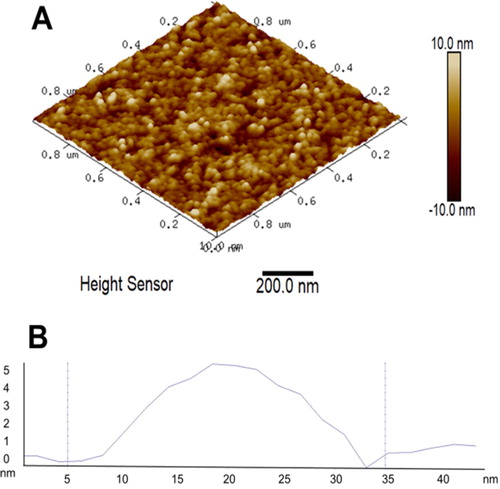
Figure 5. In vitro release of CAPE from the developed PEO-b-PCL-b-PEO micelles in acid (pH =1.2) and phosphate buffer (pH =7.4).
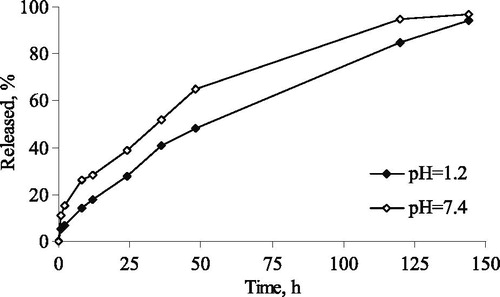
Figure 6. Effects of empty and CAPE-loaded micelles on HepG2 cell viability, assayed by the MTT reduction method (A) and LDH release (B). Note: Data are mean values ± SD. Groups were compared by one-way ANOVA with Dunnet’s post-test, comparing all columns vs. control. (CTRL) ***p < 0.001.
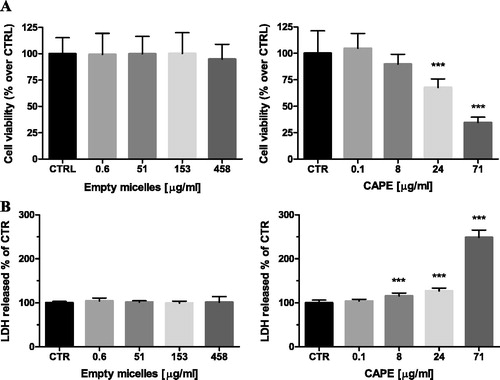
Figure 7. Effects of empty and CAPE-loaded micelles on SH-SY5Y cell viability, assayed by the MTT reduction method (A) and LDH release (B). Results are expressed as mean values ± SD. Note: Data are mean values ± SD. Groups were compared by one-way ANOVA with Dunnet’s post-test, comparing all columns vs. control. (CTRL) ***p < 0.001.
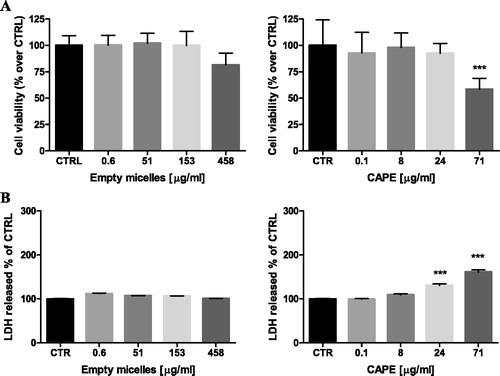
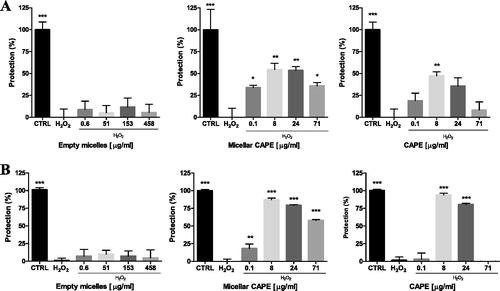
Figure 8. Protective effects of micellar and pure CAPE in a model of H2O2-induced oxidative damage in HepG2 (A) and SH-SY5Y (B) cells. Note: Data are mean values ± SD. Groups were compared by one-way ANOVA with Dunnet’s post-test, comparing all columns vs. control (CTRL) *p < 0.05; **p < 0.01, ***p < 0.001.