Figures & data
Table 1. Primer sequences of full-length gene annealing temperature used in construct plasmids.
Table 2. Primer sequences, amplicon size and annealing temperature used in real-time PCR assays.
Figure 1. A549 cells (A) and HEK293T (B) cells infected with H5N1 influenza virus.
Note: Overnight cell cultures seeded on 12-well plates were inoculated with 0.5 MOI, 1 MOI and 2 MOI H5N1 virus and incubated for 36 h. The mock group was inoculated with sterile allantoic fluid.
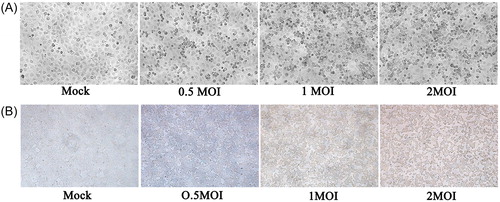
Figure 2. Expression of Yamanaka factors in A549 cells and HEK293T cells.
Note: Quantitative data (mean ± SEM) from at least three independent experiments were normalized to β-actin. *p < 0.05; **p < 0.01; ***p < 0.001.
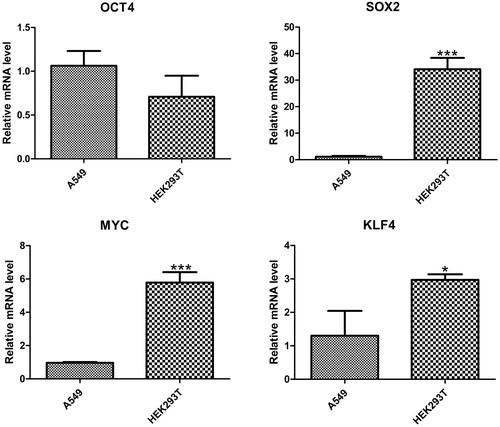
Figure 3. Gene expression of Yamanaka factors in A549 cells (A) and HEK293T cells (B) with H5N1 virus infection.
Note: Overnight cell cultures seeded 12-well plates were inoculated with 0.5 MOI, 1 MOI and 2MOI H5N1 virus and incubated for 36 h. Quantitative data (mean ± SEM) from at least three independent experiments were normalized to β-actin. *p < 0.05; **p < 0.01; ***p < 0.001. The mock group was inoculated with sterile allantoic fluid.
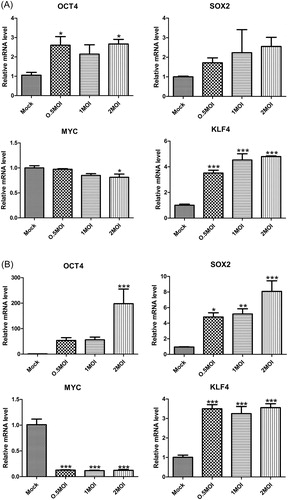
Figure 4. Effects of influenza virus proteins NP and PB2 on the gene expression of Yamanaka factors in A549 cells (A) and HEK293T cells (B). Quantitative data (mean ± SEM) from at least three independent experiments were normalized to β-actin. *p < 0.05; **p < 0.01. The mock group was inoculated with sterile allantoic fluid.
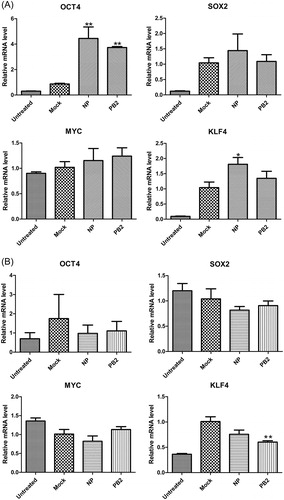
Figure 5. Effects of influenza virus proteins NS1 and M1 on the gene expression of Yamanaka factors in A549 cells (A) and HEK293T cells (B).
Note: Differences are not statistically significant.
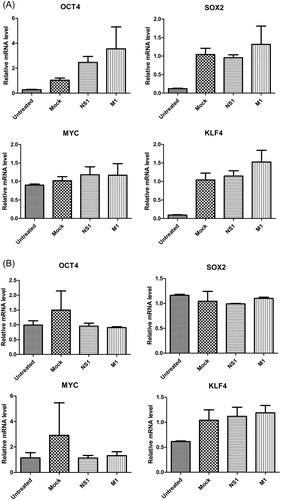
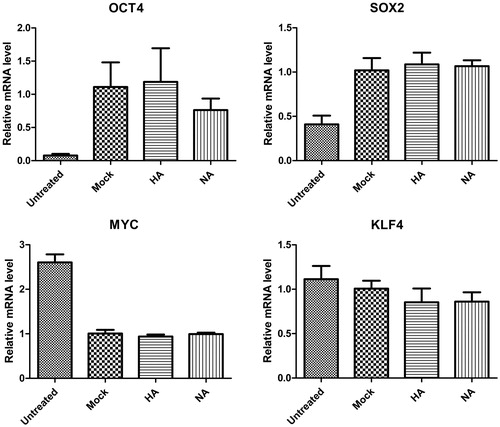
Figure 6. Effects of influenza virus proteins HA and NA on the gene expression of Yamanaka factors in HEK293T cells.
Note: Statistically non-significant differences following over-expression of HA and NA of influenza virus in HEK293T cells.