Figures & data
Figure 1. Nucleotide sequence of CsTST2 and its deduced amino acids. The N- and C-terminal MFS domains are underlined by purple and blue, respectively. The termination codon is marked by an asterisk.

Figure 2. Characterization of the deduced CsTST2 protein. (A) Predicted secondary structure of CsTST2. The blue, red, green and purple vertical lines represent alpha helices, extended strands, beta turns and random coils, respectively. (B) Predicted TM helices of CsTST2 by TMHMM 2.0.
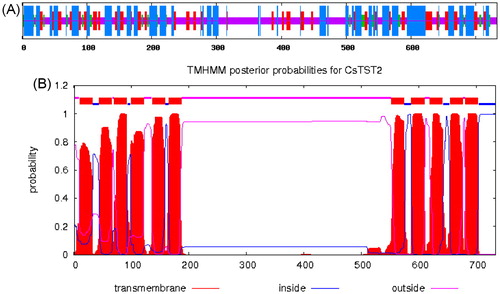
Figure 3. Sequence alignment of amino acid sequences of CsTST2 and TST proteins from various plant species. The accession numbers and sources of the TST proteins are as follows: Cucumis melo CmTST2 (XP_008448165.1), Citrullus lanatus ClTST2 (Cla000264, http://cucurbitgenomics.org/organism/1), Arabidopsis thaliana AtTMT2 (At4g35300, https://www.arabidopsis.org/), Vitis vinifera VvTMT2 (HQ323283.1), Solanum lycopersicum SlTMT2 (Solyc04g082700, https://phytozome.jgi.doe.gov/Slycopersicum), Sorghum bicolor SbTST2 (Sobic.004G099300, https://phytozome.jgi.doe.gov/Sbicolor), Oryza sativa OsTMT2 (LOC_Os02g13560, http://rice.plantbiology.msu.edu/) and Beta vulgaris BvTST2.1 (XP_010678631). The predicted TM helices are numbered and underlined.
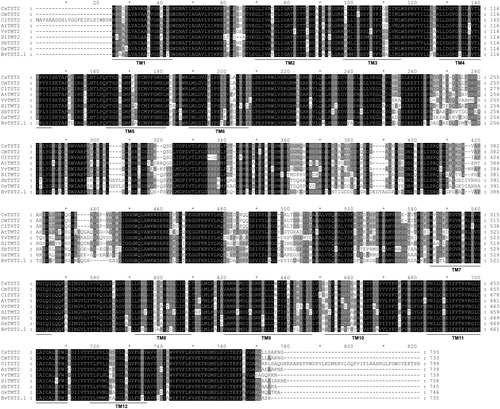
Figure 4. Phylogenetic analysis of CsTST2 and TST proteins from various plant species. The phylogenetic tree was generated using the NJ method with MEGA 5.0 software, with bootstrap support of 1000 replicates. The names and accession numbers of the TST proteins are provided in Table S1.
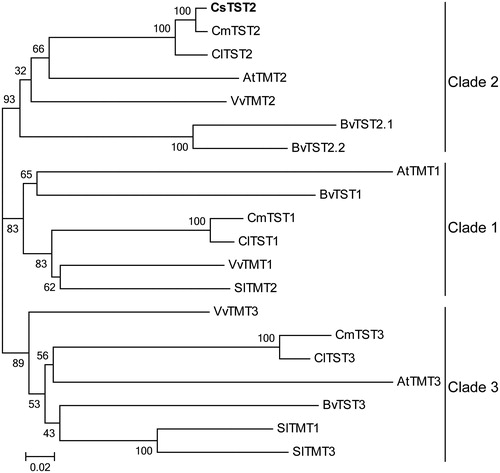
Figure 5. Expression profiles of CsTST2 in different tissues of cucumber using transcriptome data.
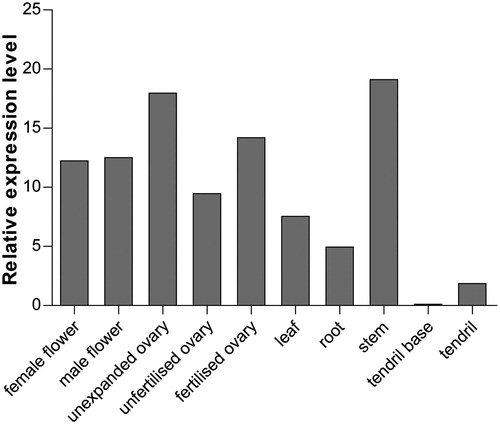
Figure 6. qRT-PCR analysis of the expression profiles of CsTST2 under various abiotic stress conditions including cold (A), salt (B), and drought (C).
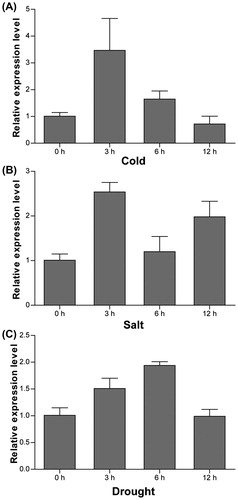
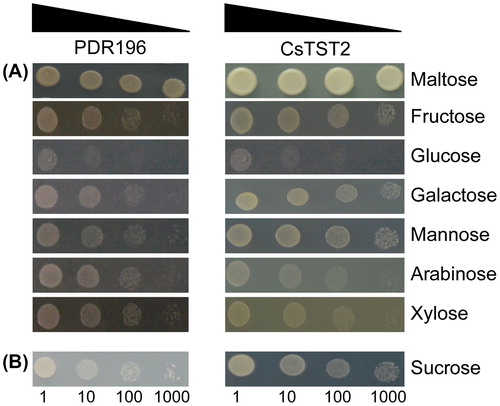
Figure 7. Functional analysis of CsTST2 in the yeast mutant strains EBY.VW4000 (A) and SUSY7/ura3 (B). Yeast cell suspensions were serially diluted (10-, 100- and 1000-fold).