Figures & data
Table 1. Oligonucleotide primers for amplification of 18 candidate reference genes.
Figure 1. Expression levels of candidate reference genes tested using the qPCR cycle threshold values (Cq).
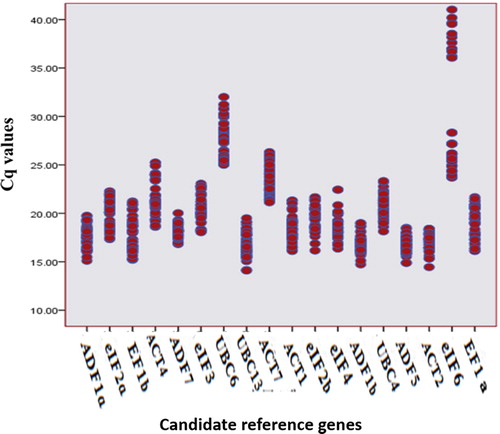
Table 2. Expression levels of 18 reference genes in B. chinense DC., B. falcatum L. and B. scorzonerifolium Willd.
Table 3. Expression stability of 18 candidate reference genes as calculated by GeNorm.
Table 4. Expression stability of 18 candidate reference genes as calculated by NormFinder.
Table 5. Expression stability of 18 candidate reference genes as calculated by BestKeeper.
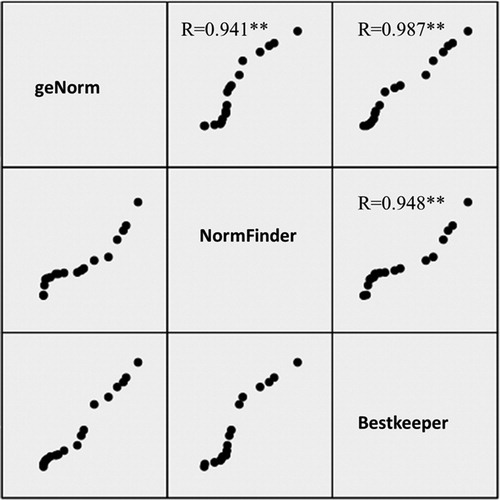
Figure 2. Comparison of the ranking results from BestKeeper, NormFinder and GeNorm. The correlation was evaluated for the ranking results of 18 candidate reference genes in all samples, by Bestkeeper, NormFinder and GeNorm. Correlation coefficient (r) values are shown (*p < 0.05, **p < 0.01).