Figures & data
Figure 1. Phytochelatin (PC) biosynthesis molecular pathway in higher plants (Modified from Inouhe [Citation8]). GSH is synthesized by two sequential enzymatic reactions by γEC synthetase and GSH synthetase from precursors, glutamine, cysteine and glycine. Subsequently, PC synthase catalyses the biosynthesis of PCs from GSH. PCs are related to glutathione (GSH) with a (γ-Glu-Cys)n-Gly structure. However, in some plants, C-terminal Gly can be replaced by serine as (γ-Glu-Cys)n-Ser, glutamine as (γ-Glu-Cys)n-Gln, glutamate as (γ-Glu-Cys)n-Glu and alanine as (-γ-Glu-Cys)n-β-Ala.
![Figure 1. Phytochelatin (PC) biosynthesis molecular pathway in higher plants (Modified from Inouhe [Citation8]). GSH is synthesized by two sequential enzymatic reactions by γEC synthetase and GSH synthetase from precursors, glutamine, cysteine and glycine. Subsequently, PC synthase catalyses the biosynthesis of PCs from GSH. PCs are related to glutathione (GSH) with a (γ-Glu-Cys)n-Gly structure. However, in some plants, C-terminal Gly can be replaced by serine as (γ-Glu-Cys)n-Ser, glutamine as (γ-Glu-Cys)n-Gln, glutamate as (γ-Glu-Cys)n-Glu and alanine as (-γ-Glu-Cys)n-β-Ala.](/cms/asset/b2c790bb-651a-4664-90b4-1cb7283b9ceb/tbeq_a_1559096_f0001_c.jpg)
Figure 2. Multiple sequence alignment of PCS proteins in 10 plant species. Sequences are aligned by ClustalW, and identical and similar residues are shaded as black and grey, respectively, with a very strict (100%) threshold. Highlighted red and yellow columns show, respectively, the strictly conserved Cys residues and catalytic triad (Cys56, His162 and Asp180 in Arabidopsis [Citation6]. Highlighted green columns also show the conserved Cys residues but some amino substitutions are observed such as Cys(C)→Ser(S)/Tyr(Y)/Trp(W). Blue and purple lines below sequences indicate the approximate locations of Phytochelatin (PF05023) and Phytochelatin_C (PF09328) domains, respectively.
![Figure 2. Multiple sequence alignment of PCS proteins in 10 plant species. Sequences are aligned by ClustalW, and identical and similar residues are shaded as black and grey, respectively, with a very strict (100%) threshold. Highlighted red and yellow columns show, respectively, the strictly conserved Cys residues and catalytic triad (Cys56, His162 and Asp180 in Arabidopsis [Citation6]. Highlighted green columns also show the conserved Cys residues but some amino substitutions are observed such as Cys(C)→Ser(S)/Tyr(Y)/Trp(W). Blue and purple lines below sequences indicate the approximate locations of Phytochelatin (PF05023) and Phytochelatin_C (PF09328) domains, respectively.](/cms/asset/0394378f-c396-47a9-a991-ac61167a27f4/tbeq_a_1559096_f0002_c.jpg)
Figure 3. Block diagram representation of the most conserved 10 motifs in PCS protein sequences. Motifs were more uniformly distributed in the N-terminal site of the enzyme. Motif 1 is indicated with red, motif 2 with cyan, motif 3 with light-green, motif 4 with purple, motif 5 with gold, motif 6 with green, motif 7 with blue, motif 8 with pink, motif 9 with orange and motif 10 with yellow.
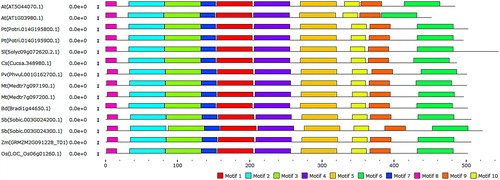
Figure 4. Gene ontology (GO) enrichment of PCS sequences. The x-axis shows the GO terms such as ‘Cellular components’, ‘Molecular functions’ and ‘Biological processes’ with blue, red and green columns, respectively. The y-axis indicates the number of GO terms.
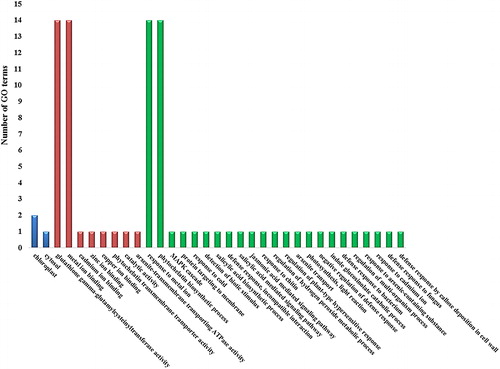
Figure 5. Phylogenetic tree showing 14 protein sequences of PCS from 10 higher plants. (A) Tree was constructed by MEGA7 using ML method based on the JTT matrix-based model and bootstrap consensus tree was generated with 1000 replicates. (B) Exon–intron organisations of PCS genes obtained from Phytozome database. Pink boxes and thin grey lines indicate the exons and introns, respectively.
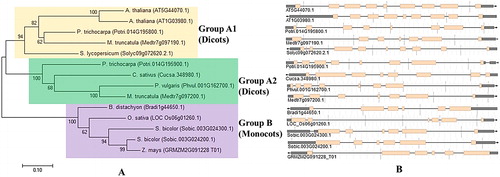
Table 1. Putative phytochelatin synthase (PCS) genes in 10 plant species and their gene/protein features.
Figure 6. Co-expression network of AtPCS1 (At5g44070; yellow node). The network was constructed by using microarray and RNA-seq datasets in the ATTED-II server. In the network, grey circles represent the nodes or genes, whereas interconnecting black lines show the edges or associations. Based on KEGG pathway (ID: ath04626), small red circles show the plant–pathogen interaction with two genes (At4g09570 and At4g26090).
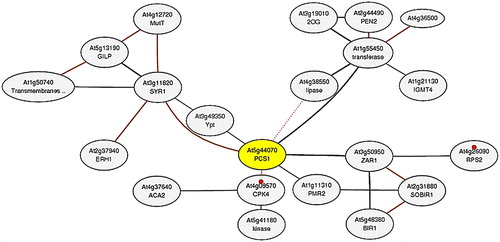
Figure 7. Cis-regulatory elements distribution at + 1000 bp upstream regions of the 14 PCS genes. Many regulatory elements were revealed in promoter sites of PCS genes but they were broadly categorized as cis-acting elements (dark blue segment), light responsive elements (red segment), hormone-responsive elements (green segment), tissue-specific elements (purple segment) and stress-responsive and other elements (light blue segment).
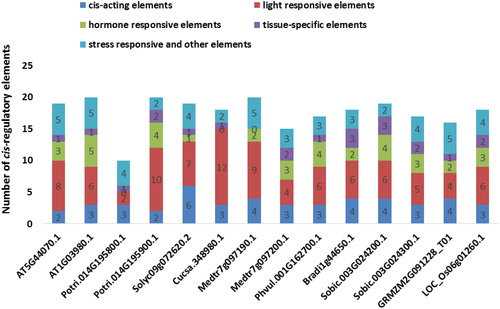
Table 2. Putative miRNAs for PCS transcripts, targeting positions and inhibition types.
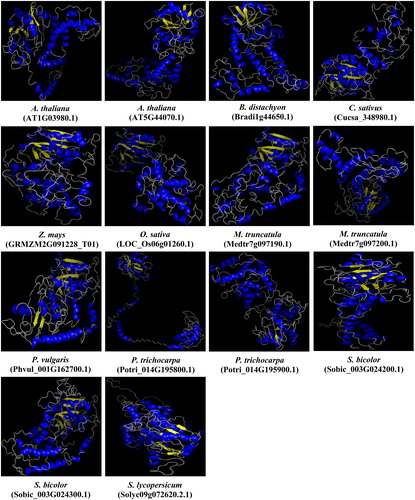
Table 3. Distribution of secondary structure elements, α-helices, β-sheets, coils and turns in PCS proteins.Table Footnote*
Figure 8. Predicted 3D models of PCS proteins in 10 different plants. Models were generated by using the Phyre2 server at intensive mode. Blue and yellow colours, respectively, show the α-helices and β-sheets, whereas other structures such as turns and coils are represented in grey.