Figures & data
Figure 1. Modes of operation of bioreactors for pDNA production and medium colour comparison.
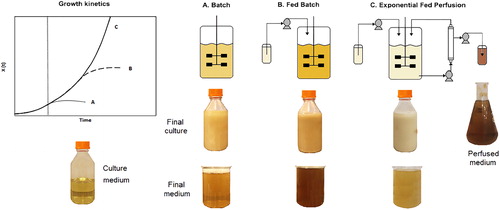
Figure 2. Kinetics of batch fermentation. Biomass growth and substrate-consumption kinetics using glucose (a) and glycerol (b). Experimental mean with standard deviation (±SD) of cell [○] and substrate [■] concentrations. Plasmid formation kinetics using glucose (c) and glycerol (d). Experimental mean with SD of VY [♦], SY [▲]. [—] Adjusted model.
![Figure 2. Kinetics of batch fermentation. Biomass growth and substrate-consumption kinetics using glucose (a) and glycerol (b). Experimental mean with standard deviation (±SD) of cell [○] and substrate [■] concentrations. Plasmid formation kinetics using glucose (c) and glycerol (d). Experimental mean with SD of VY [♦], SY [▲]. [—] Adjusted model.](/cms/asset/fe36372e-673b-463e-a727-acd2f9499747/tbeq_a_1560232_f0002_b.jpg)
Table 1. Operating and kinetic parameters of batch and EFP cultures.
Figure 3. Agarose gel electrophoresis of cell lysate of the batch fermentation. Glucose culture (a) lanes 1–5 correspond to time 0, 2, 4, 5, and 5.5 h respectively. Glycerol culture, (b) lanes 6–9 correspond to 0, 2, 4 and 5 h respectively. (M) Molecular weight marker.
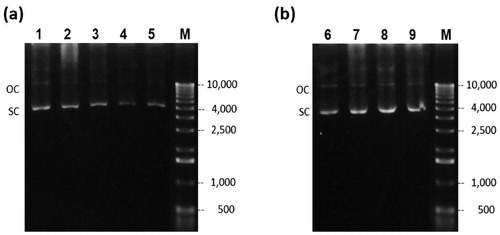
Figure 4. Kinetics of the EFP fermentation. Exponential feed with μp = 0.25 h−1. Biomass and substrate consumption kinetics using glucose (a) and glycerol (b). Experimental cell concentration [○] and substrate concentration [■]. Plasmid formation kinetics using glucose (c) and glycerol (d). Experimental VY [♦] and SY [▲]. [—] Fitted model.
![Figure 4. Kinetics of the EFP fermentation. Exponential feed with μp = 0.25 h−1. Biomass and substrate consumption kinetics using glucose (a) and glycerol (b). Experimental cell concentration [○] and substrate concentration [■]. Plasmid formation kinetics using glucose (c) and glycerol (d). Experimental VY [♦] and SY [▲]. [—] Fitted model.](/cms/asset/fbaaefde-b5ba-4f23-af49-94fa52bfacb2/tbeq_a_1560232_f0004_b.jpg)
Figure 5. Agarose gel electrophoresis of cell lysate of the EFP fermentation. Glucose culture (a) lanes 1–8 correspond to samples at time 0, 4, 5, 5.5, 6, 8, 10, and 12 h respectively. Glycerol culture (b) lanes 9–16 correspond to time 0, 4, 5, 6, 8, 10, 11, and 12 h respectively. (M) Molecular weight marker.
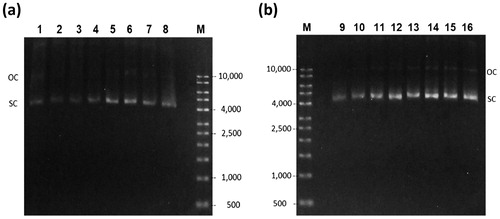
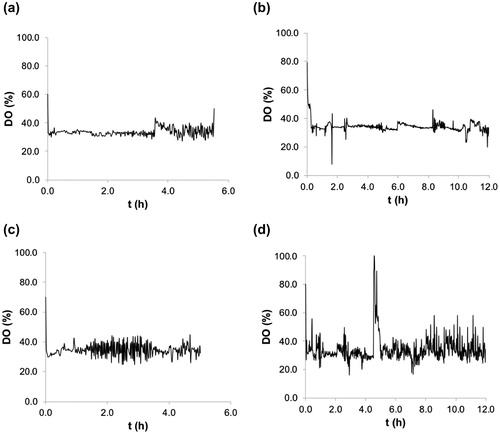
Figure 6. Dissolved oxygen control. Batch (a) and EFP (b) experiments using glucose and batch (c) and EFP (d) experiments using glycerol.