
Figures & data
Figure 1. Cohort selection.
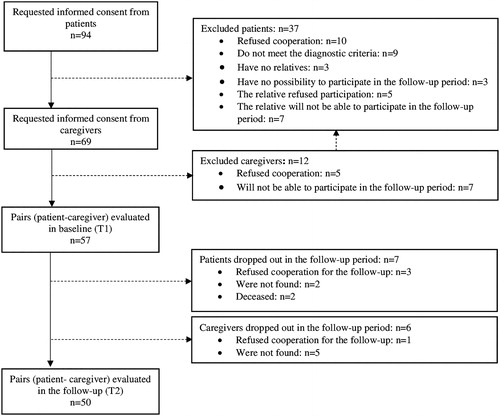
Table 1. Type of resources evaluated, recall periods, unit cost and the source of data for the unit costs.
Table 2. Service use and costs at baseline (T1) and 12-month follow-up (T2).
Table 3. Comparison of costsTable Footnotea and outcomes at baseline (T1) and 12-month follow-up (T2).
Table 4. Results of cost-effectiveness analysis.
Figure 2. Distribution of bootstrapped incremental cost-effectiveness ratios (ICERs) (n = 1000) in the cost-effectiveness plane for PANSS (A), PSP (B), MANSA (C) and BAS (D).
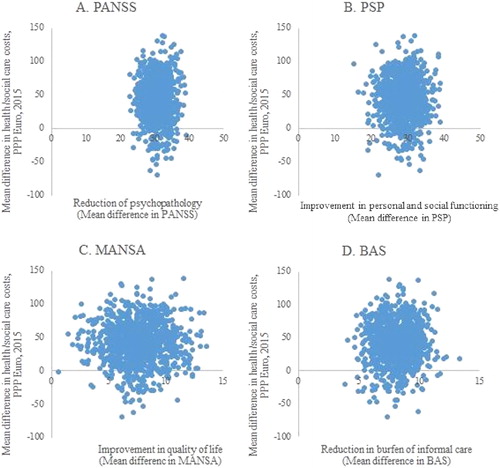
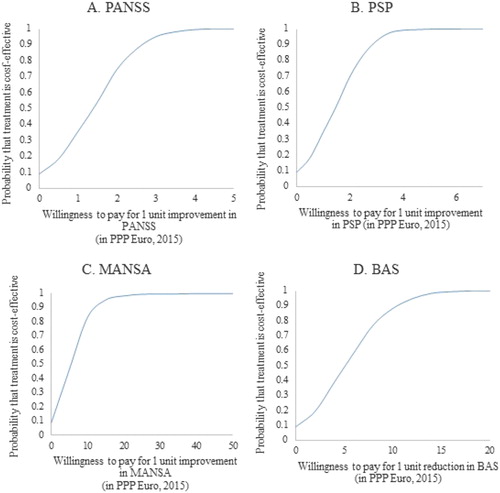
Figure 3. Cost-effectiveness acceptability curves based on the willingness to pay for 1 unit improvement in PANSS (A), PSP (B), MANSA (C) and BAS (D).
Data availability statement
The data that support the findings of this study are available from the corresponding author, [MK], upon reasonable request.