Figures & data
Figure 1. LM microphotographs of strain ACUS 00002 from culture material in 2007–2009 (a, b, e, i) and in May 2018 (c, d, f, g, h).
Note: Scale bar is indicated on each microphotograph.
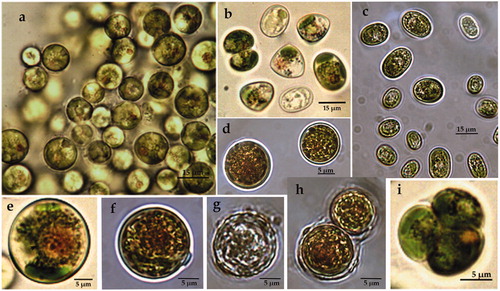
Figure 2. LM microphotographs of strain ACUS 00010 from culture material in 2007–2009 (a, c, g) and in May 2018 (b, d, e, f).
Note: Scale bar is indicated on each microphotograph.
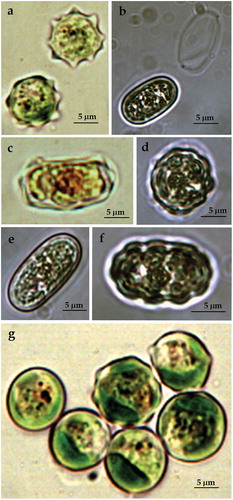
Figure 3. LM microphotographs of strain ACUS 00024 from culture material in 2007–2009 (a, h) and in May 2018 (b–g, i).
Note: Scale bar is indicated on each microphotograph.
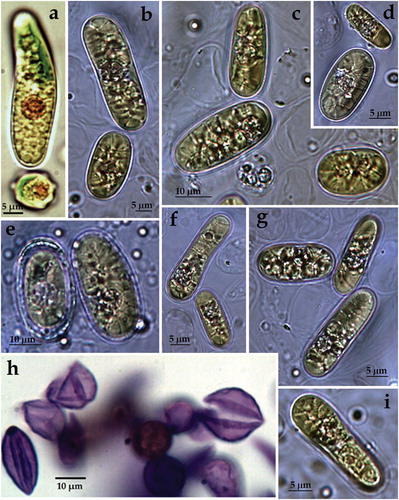
Figure 4. LM microphotographs of strain ACUS 00025 from culture material in 2007–2009 (c, e, d) and in May 2018 (a, b, f, g).
Note: Scale bar is indicated on each microphotograph.
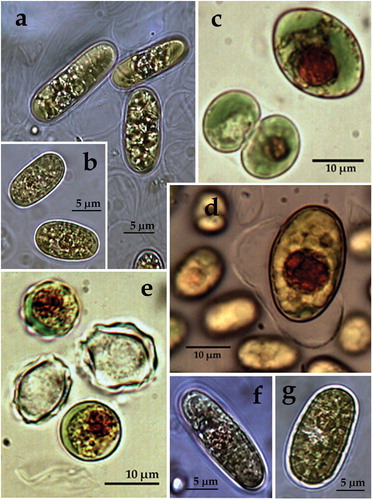
Figure 5. LM microphotographs of strain ACUS 00104 from culture material in 2012/2013 (a, c, d) and in May 2018 (b, e, f).
Note: Scale bar is indicated on each microphotograph.
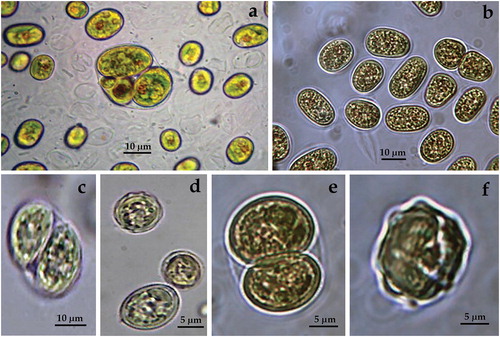
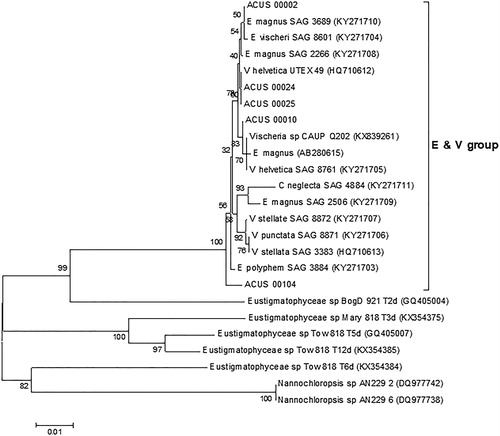
Figure 6. Neighbour joining phylogenetic tree of rbcL sequences constructed from studied ACUS strain sequences and their closest homologous sequences retrieved after BLAST search. Bootstrap values greater than 50% confidence are shown at branching points (percentage of 1000 resamplings). Sequence accession numbers are shown in brackets. The Eustigmatos/Vischeria phylogroup is designated with ‘E & V group’.