Figures & data
Figure 1. Bacterial growth and E2 degradation.
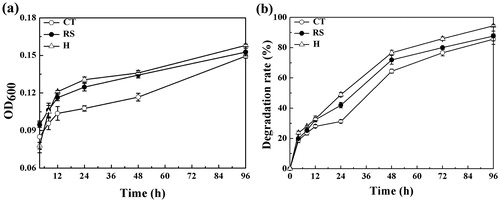
Figure 2. Effect of E2 concentration on E2 degradation by single bacterial cultures.
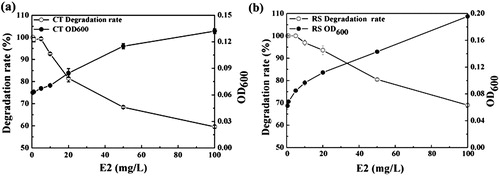
Figure 3. HPLC determination of metabolites produced by the degradation of E2 by CT, RS and H cultures.
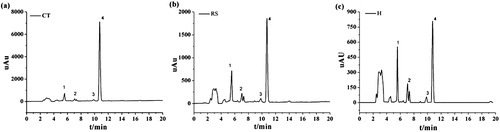
Figure 4. Mass spectrometry analysis of the products of E2 degradation by the CT, RS and H cultures.
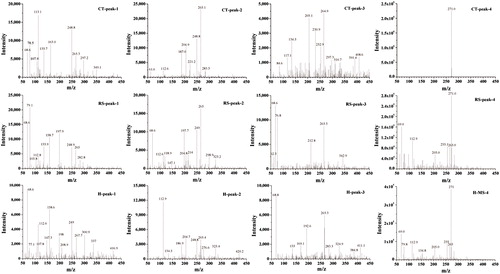
Figure 5. LC–MS/MS spectra of metabolites of E2.
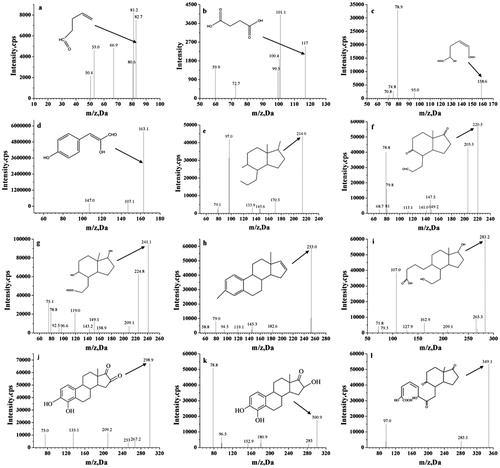
Table 1. E2 degradation products produced by strain CT, strain RS and the mixed bacterial culture H.
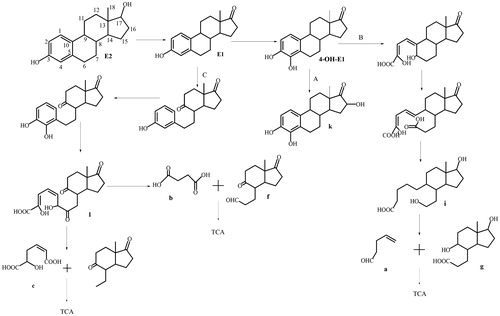
Figure 6. Pathways of E2 degradation by the mixed bacterial culture.