Figures & data
Figure 1. Total phenol and flavonoid content in aqueous leaf extract of P. integrifolia. Note: Values are means ± SD (N = 3).
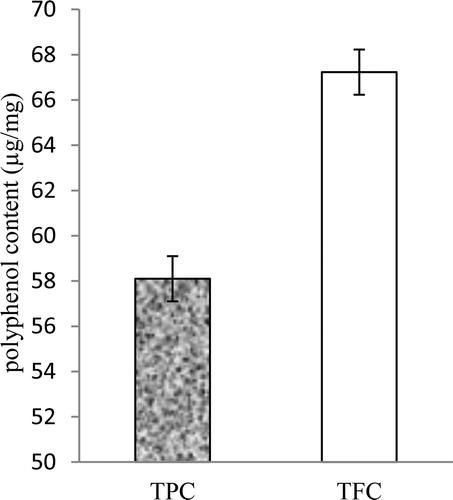
Figure 2. Biosynthesis of silver nanoparticles (a): P. integrifolia plant, aqueous silver nitrate solution (1), aqueous leaf extract (2), silver nanoparticles (AEP-AgNPs) (3); (b): UV-Vis spectra; (c): UV–Vis absorbance spectra peak of prepared AEP-AgNPs at different time intervals during sunlight exposure; (d): UV–Vis spectra of AEP-AgNPs prepared at different inoculum doses (%) of AEP; (e): UV–Vis spectra of AEP-AgNPs prepared at different silver nitrate concentrations (mmol/L).
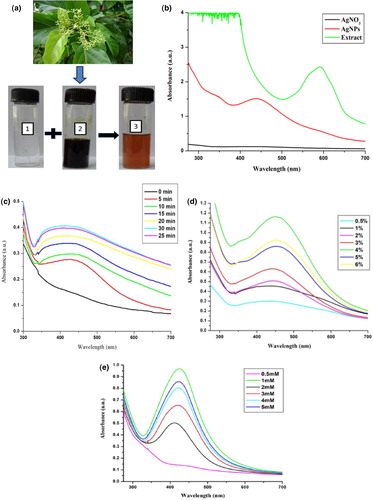
Figure 3. FT-IR spectra of aqueous leaf extract of P. integrifolia (AEP) and AEP-AgNPs.
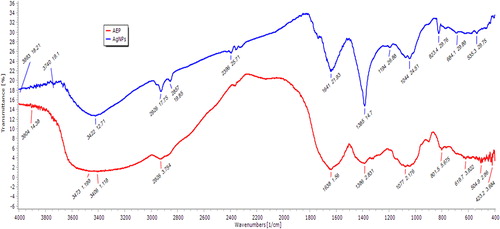
Figure 4. X-ray diffraction pattern of synthesized AEP-AgNPs using aqueous leaf extract of P. integrifolia.
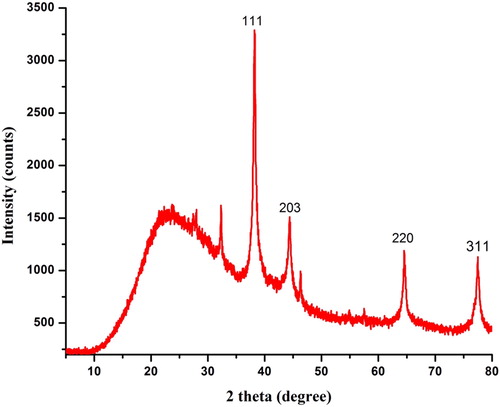
Figure 5. HRTEM images of AEP-AgNPs at different magnifications (a and b), SAED pattern of AEP-AgNPs (c) and size distribution histogram (d).
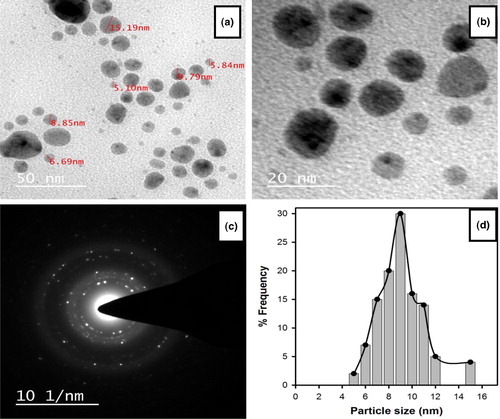
Figure 6. HRSEM micrograph of AgNPs synthesized using aqueous leaf extract of P. integrifolia (a) and energy dispersive X-ray spectrum of AEP-AgNPs (b).
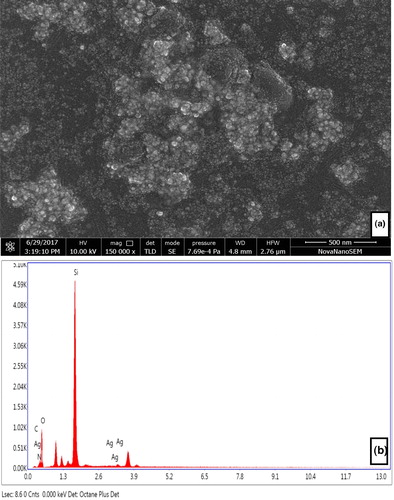
Figure 7. AFM images of green synthesized AgNPs using P. integrifolia aqueous leaf extract: 2D (a) and 3D view (b) and roughness profile (c) of AEP-AgNPs.
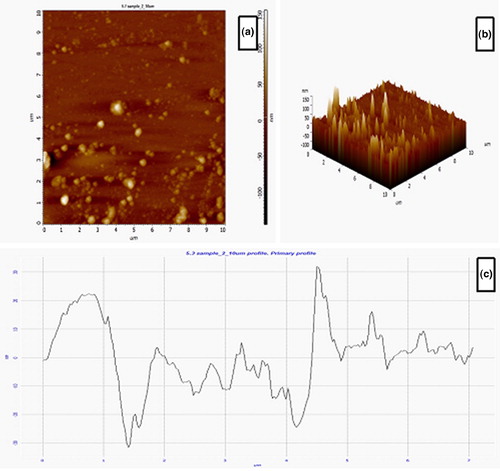
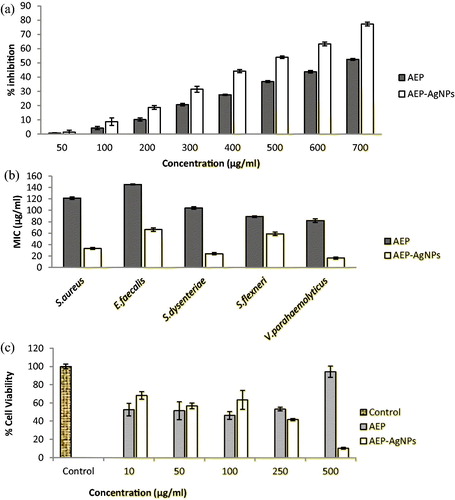
Figure 8. Antioxidant (a), antimicrobial (b) and cytotoxic (c) activity of aqueous leaf extract (AEP) and silver nanoparticles synthesized using aqueous leaf extract of P. integrifolia.