Figures & data
Figure 1. Zeta potential of the chitosan nanoparticles and CpG ODN/chitosan nanoparticle conjugate. Note: Each sample was measured three times to obtain the average size and standard deviation (SD) values.
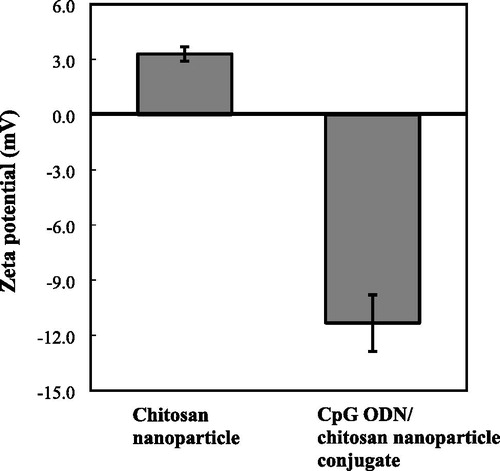
Figure 2. Chitosan nanoparticles observed by transmission electron microscopy (TEM) (magnification 71,000×).
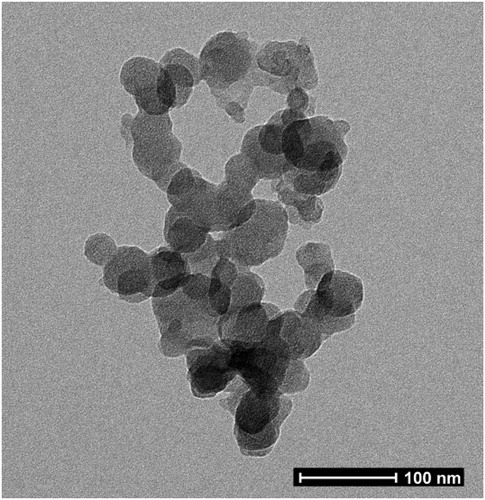
Table 1. Chitosan nanoparticle size as measured by dynamic light scattering methods.
Figure 3. Cytotoxicity assay of chitosan nanoparticles in murine macrophage RAW-Blue cells. Note: Cells incubated without chitosan nanoparticles were used as a control.
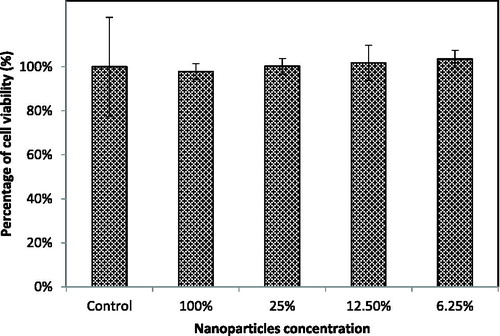
Figure 4. NF-κB/AP-1 activation in murine RAW-blue cells with the CpG ODN/chitosan nanoparticle conjugate. Note: Data are presented as mean values with SD (n = 6); NP, chitosan nanoparticles.
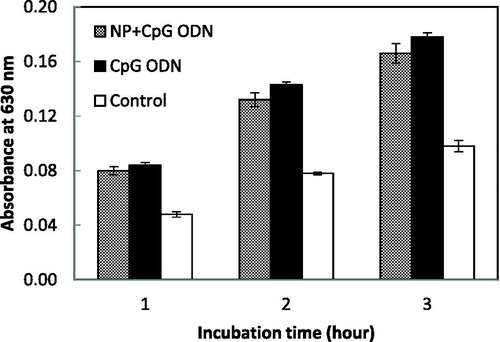
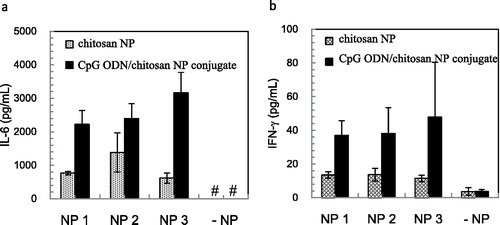
Figure 5. IL-6 (a) and IFN-γ (b) induction in human PBMCs stimulated with chitosan nanoparticles. Note: The level of induction of each cytokine was measured with three different lots of chitosan nanoparticles. Data are presented as mean values with SD (n = 5). #IL-6 production level is lower than 313 pg/mL. NP, chitosan nanoparticles.