Figures & data
Table 1. Scoring criteria for lung injury.
Figure 1. Pathological changes of lung tissue in different groups. Representative H&E staining results (A) and lung injury score (B).
Note: Scale bar = 16 μm; ap <0.05 vs. Group C; b p <0.05 vs. Group S; c p <0.05 vs. Group L. Data are means ± SD, n = 10 in each group.
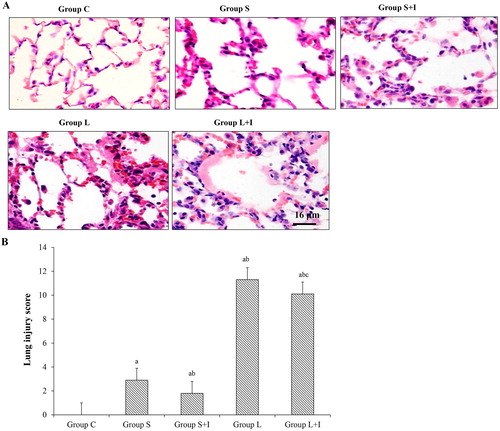
Figure 2. Expression of P38 MAPK and p-P38 MAPK in different groups.
Note: Error bars represent S.D. of 10 rats a p < 0.05 vs. Group C; b p < 0.05 vs. Group S; c p < 0.05 vs. Group L.
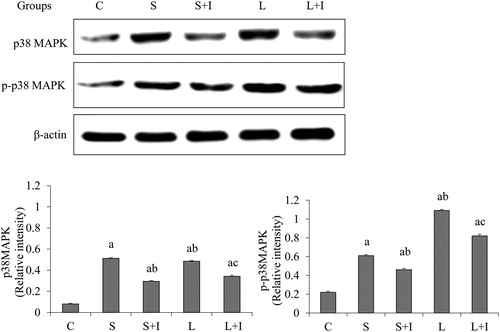
Figure 3. Expression of AQP5 in lung tissues of different groups examined by immunohistochemical analysis (A) and western blot assay (B).
Note: Scale bar: 16 μm. Error bars represent S.D. of 10 rats. a p < 0.05 vs. Group C; bp < 0.05 vs. Group S; cp < 0.05 vs. Group L.
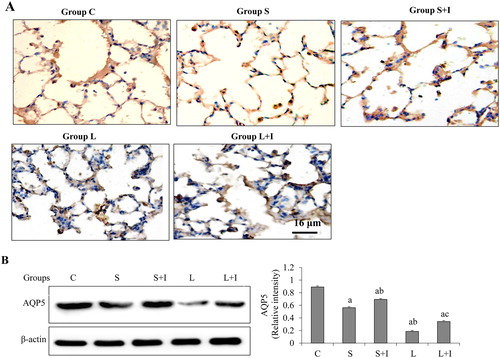
Figure 4. W/D (A) and PMN counts (B) in different groups.
Note: a p < 0.05 vs. Group C; b p < 0.05 vs. Group S; c p < 0.05 vs. Group L. Data are shown means ± SD, n = 10 in each group.
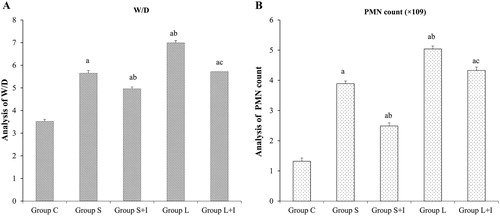
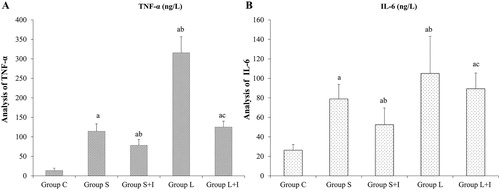
Figure 5. TNF-α (A) and IL-6 (B) in different groups.
Note: a p < 0.05 vs. Group C; b p < 0.05 vs. Group S; cp < 0.05 vs. Group L. Data are means ± SD, n = 10 in each group.