
Figures & data
Table 1. List of the studied species, the location of their collection and the short names of the samples as they appear in phylogenic trees.
Figure 1. Relative germination percentage of seeds of O. cumana, P. ramosa and P. mutelii/P. rosmarina after treatment with GR24.
Note: The seeds were preconditioned for 14 days before treatment. Portions of the seeds of each species were treated with nano pure, sterile water in order to serve as negative controls.
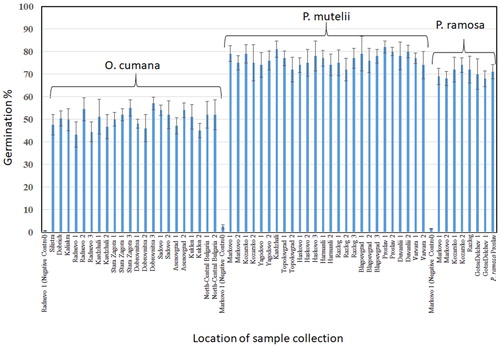
Table 2. List of specific primers designed for isolation of ITS1/2 sequences.
Figure 2. Phylogenetic tree based on O. cumana ITS1/2 sequences annotated in NCBI and the sequences isolated from all Bulgarian samples. Maximum likelihood was used, applying the general time reversal model and a uniform rate of substitution. Phylogeny test – bootstrap method by 500 replications. The samples are listed in . Four sequences annotated in NCBI by other authors were incorporated in the tree as reference samples.
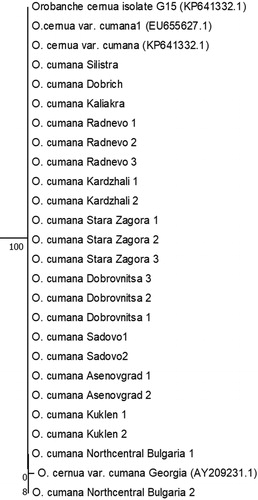
Figure 3. Phylogenetic tree based on P. ramosa and P. mutelii/P.rosmarina ITS1/2 sequences annotated in NCBI and the sequences isolated from the Bulgarian representatives. Maximum likelihood was used, applying the general time reversal model and a uniform rate of substitution. Phylogeny test – bootstrap method by 500 replications. The samples are listed in . Ten sequences annotated in NCBI by other authors were incorporated in the tree for comparison.
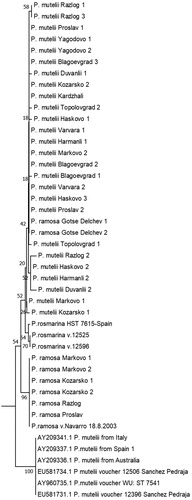
Table 3. Comparative list of unique SNPs in ITS1/2 sequences of P. mutelii, P. rosmarina and our samples.